T005 Leukemia
Version: 0.1.0
Last change: May 07, 2022
We observe a separation between acute lymphoblastic leukemia (ALL), which cluster in T119 ALL (n = 334), and acute myeloid leukemia (AML), which cluster in T120 AML (n = 472) at the second hierarchical level. A significant difference in age is expected due to the different etiologies (median age 7.16 vs 16.76 y.o., MWU adj. p-val = 2.98e-23) and the presence of both adult and pediatric populations in both groups to different degrees. No significant difference in OS is observed.
Acute lymphoblastic leukemia
Within the lymphoblastic branch, we immediately observe the separation of a small group of infant leukemias with KMT2A rearrangements, found in T121 ALL INF KMT2Ar (n =14), from all other diagnoses, in T122 ALL A (n = 320) (Fig. LEU1).
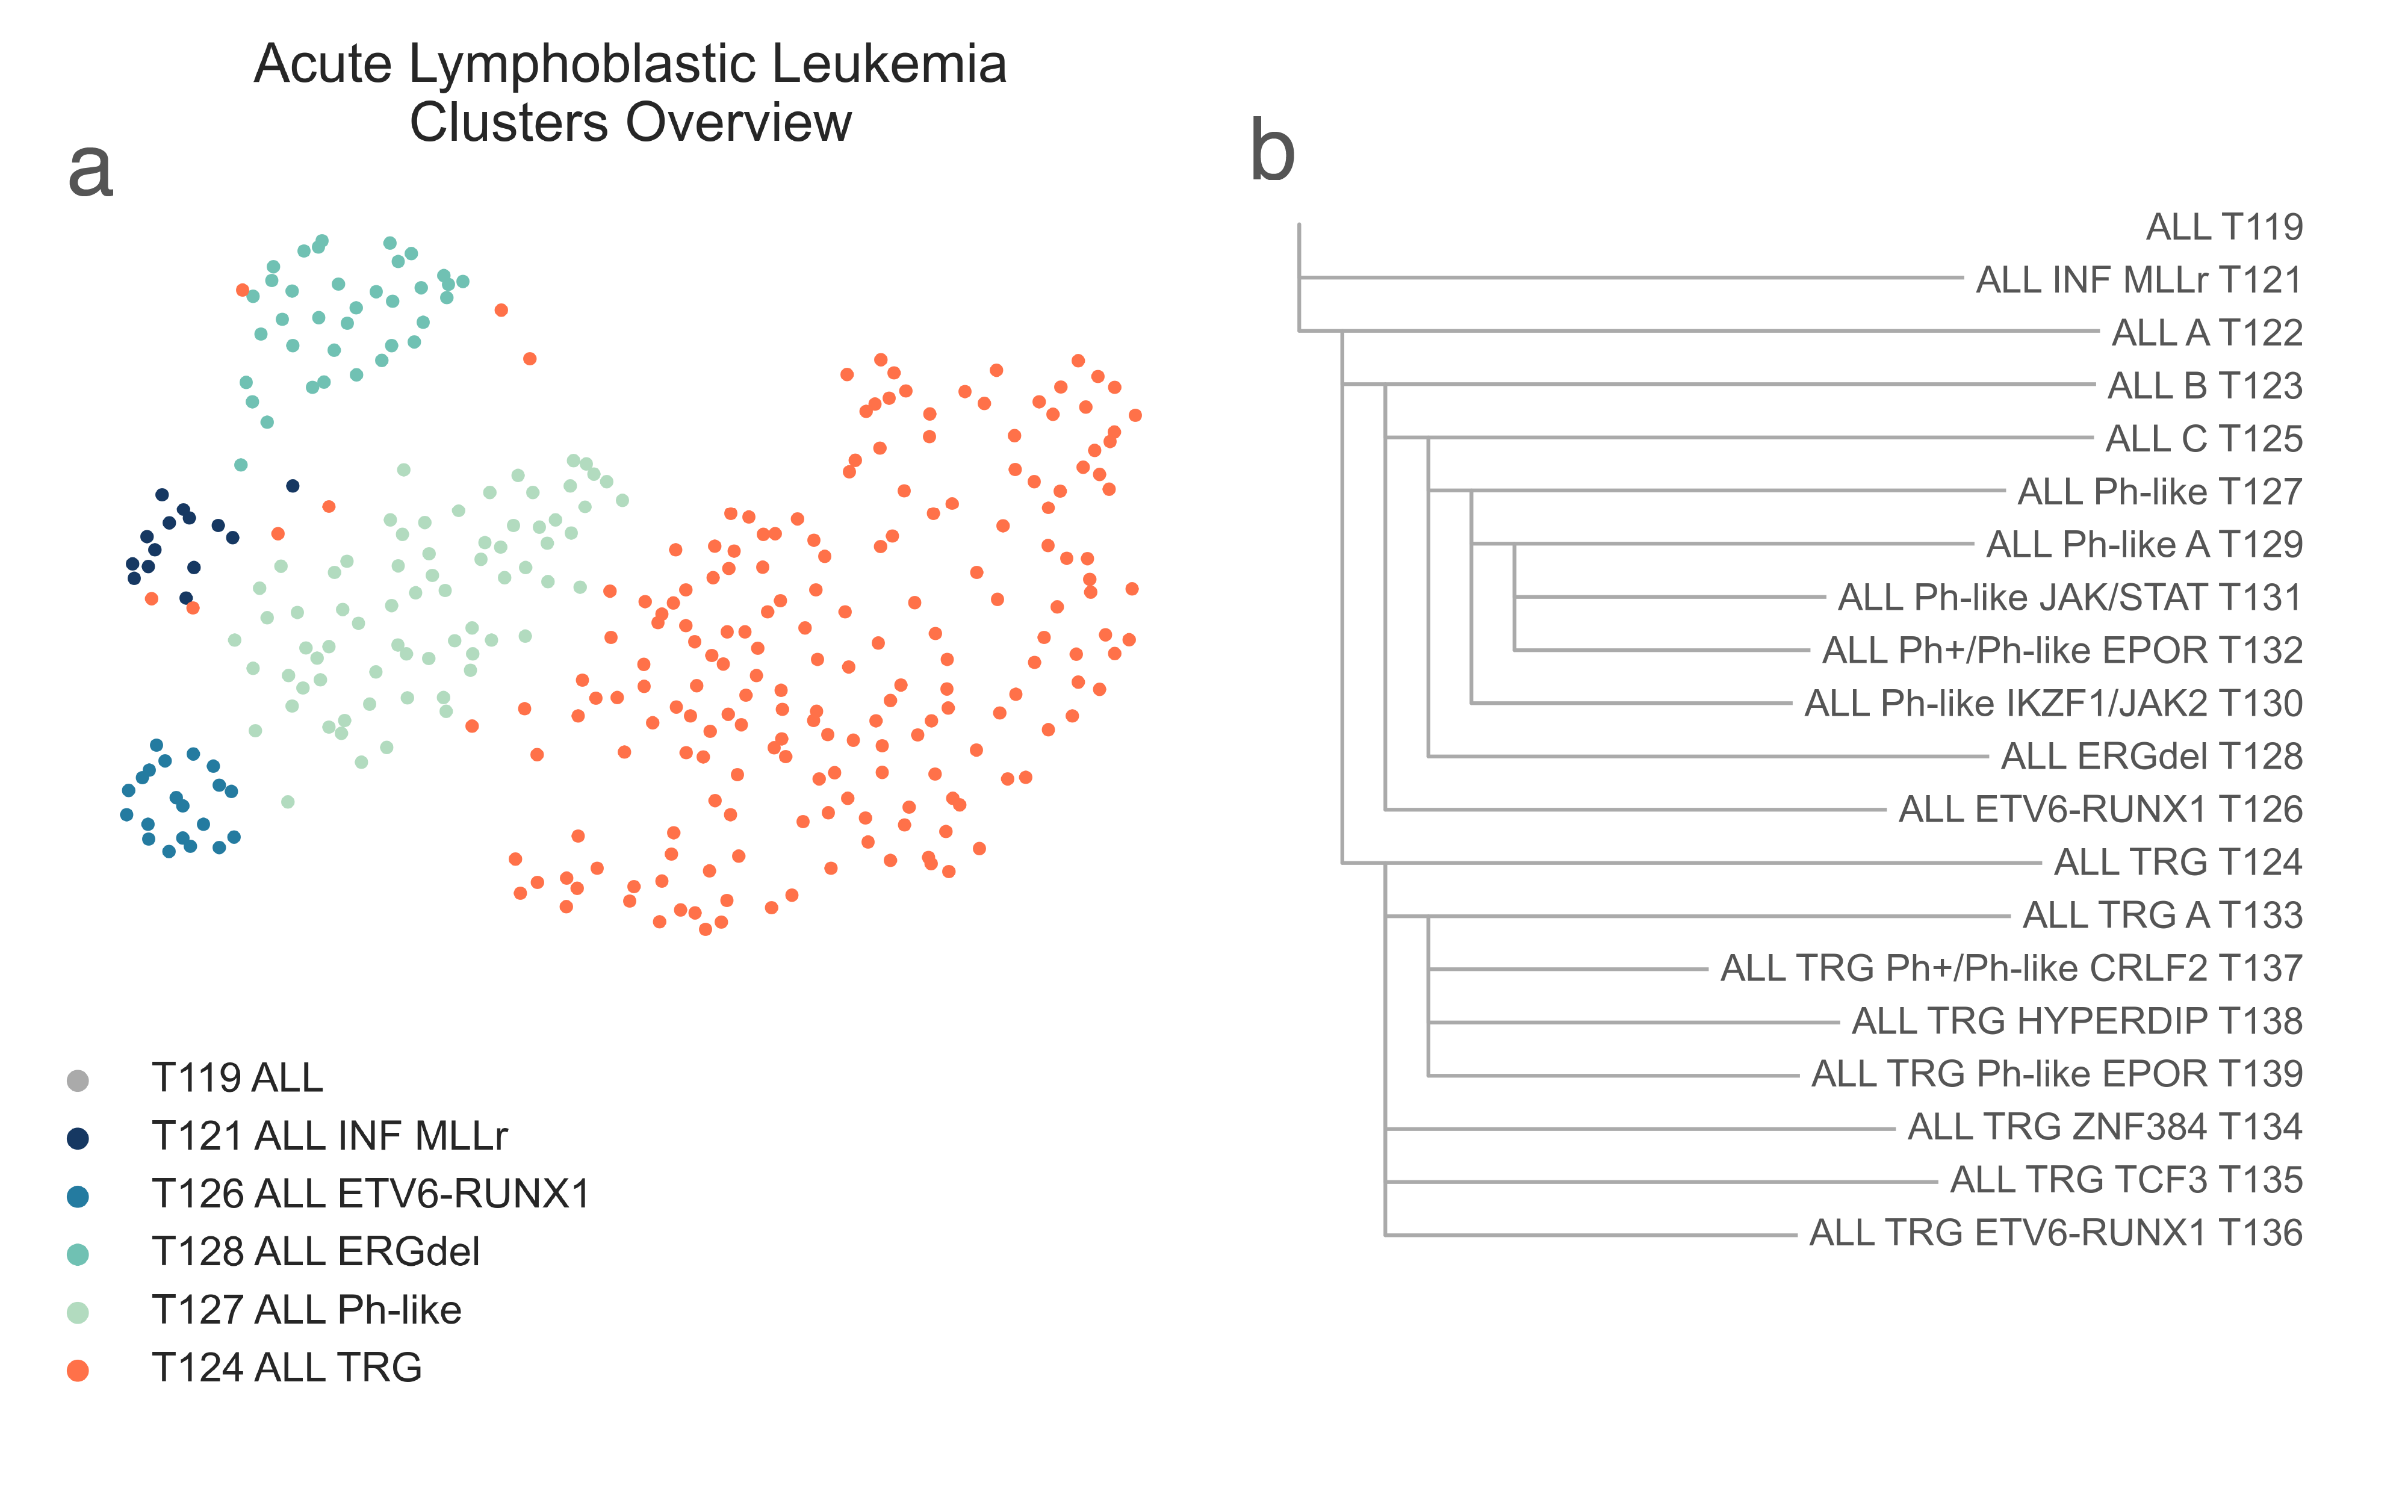
LEU1: A, 2-dimensional UMAP projection of acute lymphoid leukemia tumors by gene expression. Subtypes at the third level of the hierarchy are shown with different colours. B, the list of all acute lymphoid leukemia subtypes identified and their hierarchical relationship.
T121 ALL INF KMT2Ar contains most samples marked as infant (6 vs 1 χ2 p-val < 2.20e-16) and mixed-lineage leukemia (4 vs 0, χ2 p-val < 2.20e-16) and has a significantly younger median age (0.73 vs 7.20 y.o., MWU p-value = 4.37e-02). We confirmed this annotation with gene sets, as T121 ALL INF KMT2Ar is highly enriched for KMT2A downstream targets (medNES = 1.50 , MWU adj. p-val = 2.47e-09) [Ross2004] (Fig. LEU2).
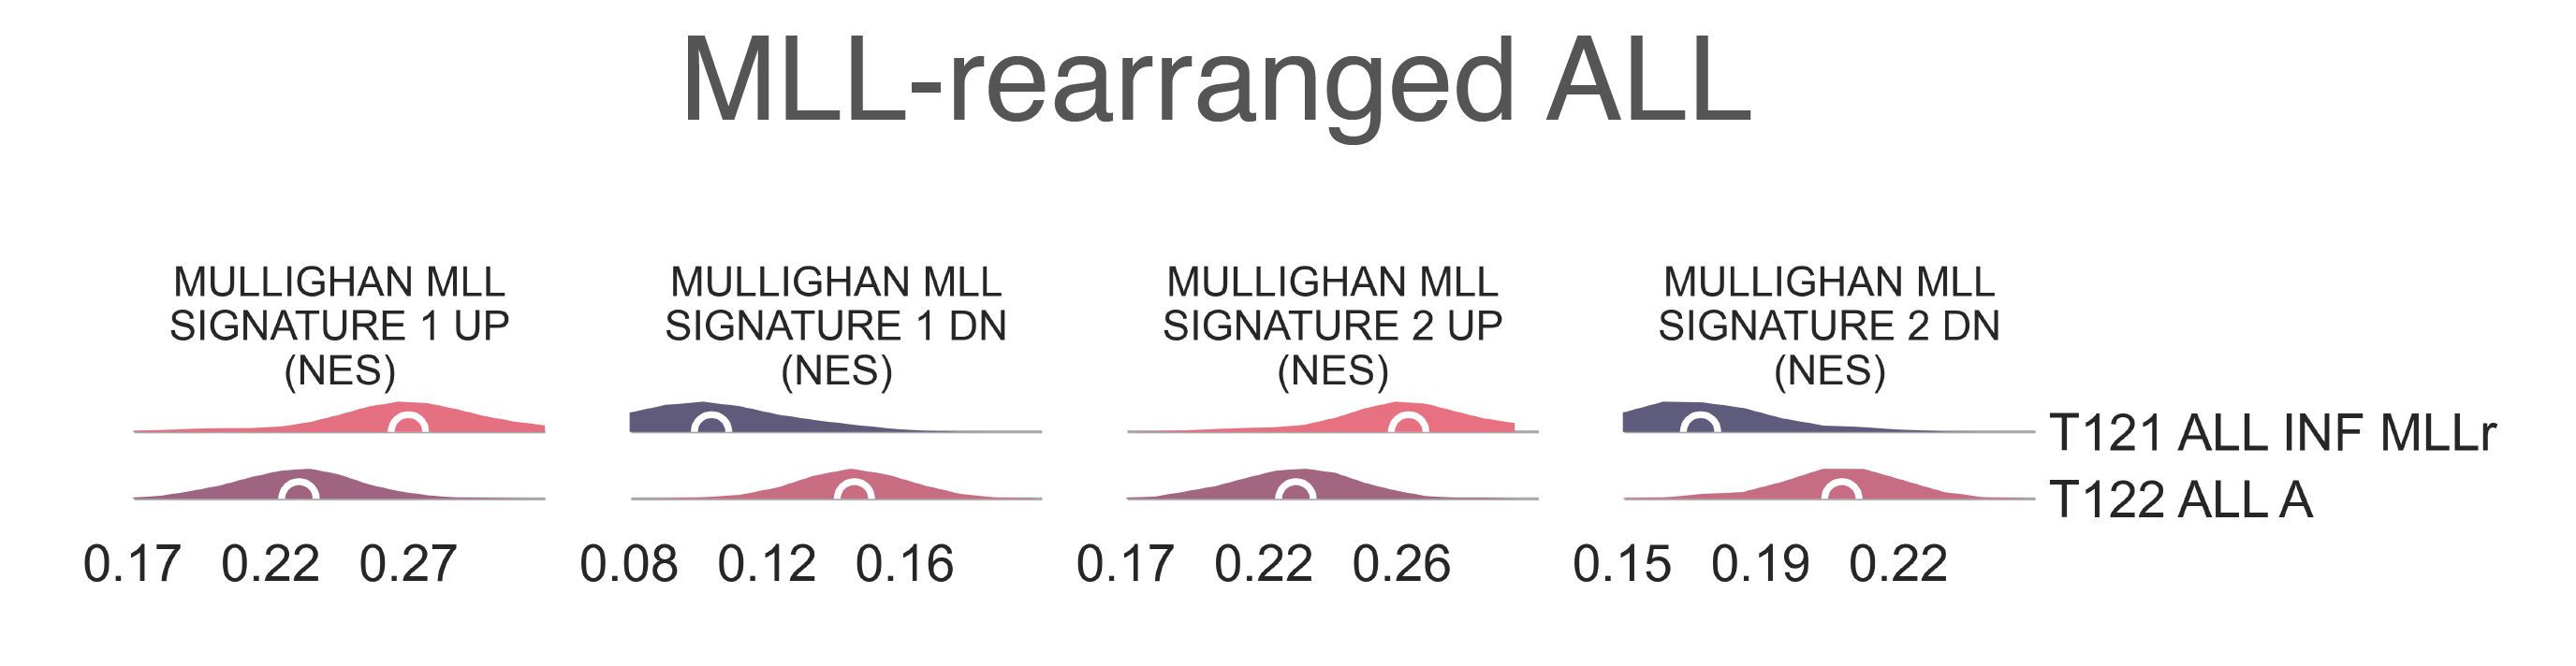
LEU2: Distribution plots of the expression of genes and gene sets relevant to the definition of the KMT2A-rearranged lymphoblastic leukemia class.
T122 ALL A further splits into two subclasses, T123 ALL B (n = 127) and T124 ALL TRG (n = 193) (Fig. LEU1b), containing most of samples from TARGET. Gene sets analysis between all TARGET leukemia samples and the remaining cohort shows enrichment (MWU adj. p-val < 1.00e-10) of poly-A RNA binding, ribonucleoprotein complex, RNA processing, ribosomal and mitochondrial pathways, and oxidative phosphorylation [Ashburner2000], [The2019] in T124 ALL TRG. Furthermore, T124 ALL TRG has a lower median age (6.41 vs 13.17 y.o., MWU adj. p-val = 5.04e-08). We couldn’t identify any biological driver behind the split between T123 ALL B and T124 ALL TRG with statistical certainty; stringent low variance genes removal or more advanced batch effect removal methods (e.g. COMBaT [Lazar2013]) weren’t enough to assure complete compatibility between the TARGET cohort and the rest of the dataset without the loss of information and damage to the subtyping process. We decided to keep the clusters separate as by choice of the algorithm and further investigate their subtypes independently, to maintain tumor subtypes that were exclusive of one or the other cohorts and increase the classifier range.
Acute lymphoblastic leukemia, non-TARGET cohort
At the next level within T123 ALL B, we observe the separation of
T126 ALL ETV6-RUNX1 (n = 20) a small class of samples marked with
ETV6-RUNX1 fusion (χ2 p-val < 2.20e-16) from the remaining ALL
in T125 ALL C (n=107) (Fig. LEU1b).
The t(12;21)(p13;q22) translocation which results from this fusion is often accompanied by copy number gains in RUNX1,
which is overexpressed in T126 ALL ETV6-RUNX1
(logFC = 4.17e-01, FDR = 3.33e-03).
Compared to patients in T125 ALL C, those in
T126 ALL ETV6-RUNX1 are significantly younger
(14.5 vs. 4.46 y.o., MWU adj. p-val = 3.29e-08) [Sun2017].
The children of T125 ALL C separate into
T128 ALL ERGdel (n = 36) and
T127 ALL Ph-like (n = 71) (Fig. LEU1b).
T128 ALL ERGdel is characterized by tumors carrying
ERG deletions (15 vs. 55, χ2 p-val < 2.20e-16), and exhibits characteristic overexpression of
CHST2 (logFC = -4.48, FDR = 5.742e-33),
PTPRM (logFC = -7.64, FDR = 2.987e-32), and
GPR49/AGAP1 (logFC = -6.23, FDR = 3.201e-31) [Yeoh2002].
The majority of samples in T127 are composed of Ph-like tumors of various classes (χ2 p-val < 2.2e-16) [Jain2017].
T127 ALL Ph-like then further subdivides in two child nodes,
T129 ALL Ph-like A (n = 41) and
T130 ALL Ph-like IKZF1/JAK2 (n = 29) (Fig. LEU1b).
Both contain small populations of BCR-ABL1 fusion samples (Ph+) (11 and 5, ns) and Philadelphia-like (Ph-like) samples (13 and 14, ns).
While T129 ALL Ph-like A contains the majority of
Ph-like non- CRFL2 tumors (11/28 vs. 14/19, χ2 p-val = 4.32e-02),
there is no corresponding enrichment of this signature via gene sets analysis.
However, the two differ by some specific lesions known to be present in the Ph-like group:
T129 ALL Ph-like A contains 6
JAK2 fusion samples (0/13 vs 6/14, χ2 p-val = 2.69e-02),
while T130 ALL Ph-like IKZF1/JAK2 contains all
EPO fusion samples (4/13 vs. 0/14, FET p-val 4.07e-02).
Both contain other JAK/STAT alterations (4/13 vs. 3/14, ns), and two of other ABL1/2 fusion samples each.
T130 ALL Ph-like IKZF1/JAK2
is also enriched for tumors with concurrent IKZF1 alterations (11/28 vs. 14/19, χ2 p-val = 4.32e-02).
T129 ALL Ph-like A
then divides into two further subtypes, T131 ALL Ph-like JAK/STAT
(n=23) and T132 ALL Ph+/Ph-like EPOR (n =12) (Fig. LEU3a).
T132 ALL Ph+/Ph-like EPOR contains the majority of
BCR-ABL1 fusion samples (3/23 vs. 8/12, p-val = 4.23e-03).
Of the Ph-like samples for which we have annotation,
T131 ALL Ph-like JAK/STAT
contains 4 unspecified JAK/STAT mutants along with an additional CRLF2-JAK mutant, a CRFL2 rearranged sample with no
JAK rearrangements, and a RAS mutant (Fig. LEU3a).
T132 ALL Ph+/Ph-like EPOR contains 3
EPOR-IGH fusion samples, while T131 ALL Ph-like JAK/STAT
contains an EPOR-IGK fusion (n.s.).
Both groups contain one ABL fusion without CRFL2 rearrangement, while Ph-like non-CRLF2 samples are evenly
divided between the clusters (7/20 vs. 4/8, n.s.).
Another interesting distinction is that T131 ALL Ph-like JAK/STAT
is enriched for tumors with cell-cycle related lesions, either in TP53,
CDK2NA/B, or RB1 (14/20 vs. 1/8, χ2 p-val = 1.95e-2).
T132 ALL Ph+/Ph-like EPOR,
however, is enriched for samples with concurrent IKZF1 alterations (5/20 vs. 6/8, χ2 p-val = 4.35e-02),
though these are heterogeneous and have some overlap between the two clusters [Harvey2013].
Gene set enrichment analysis demonstrates T131 ALL Ph-like JAK/STAT
to be enriched for non-Ph-like CRFL2 rearranged samples (medNES = 1.57, MWU adj. p-val = 4.70e-05),
while T132 ALL Ph+/Ph-like EPOR
is enriched for Ph-like samples with CRFL2 rearrangments
(medNES = 2.68, MWU adj. p-val = 1.61e-07)
[Sadras2017] (Fig. LEU3b), suggesting that
T132 ALL Ph+/Ph-like EPOR may contain
CRFL2-rearranged samples which have not been annotated as such.
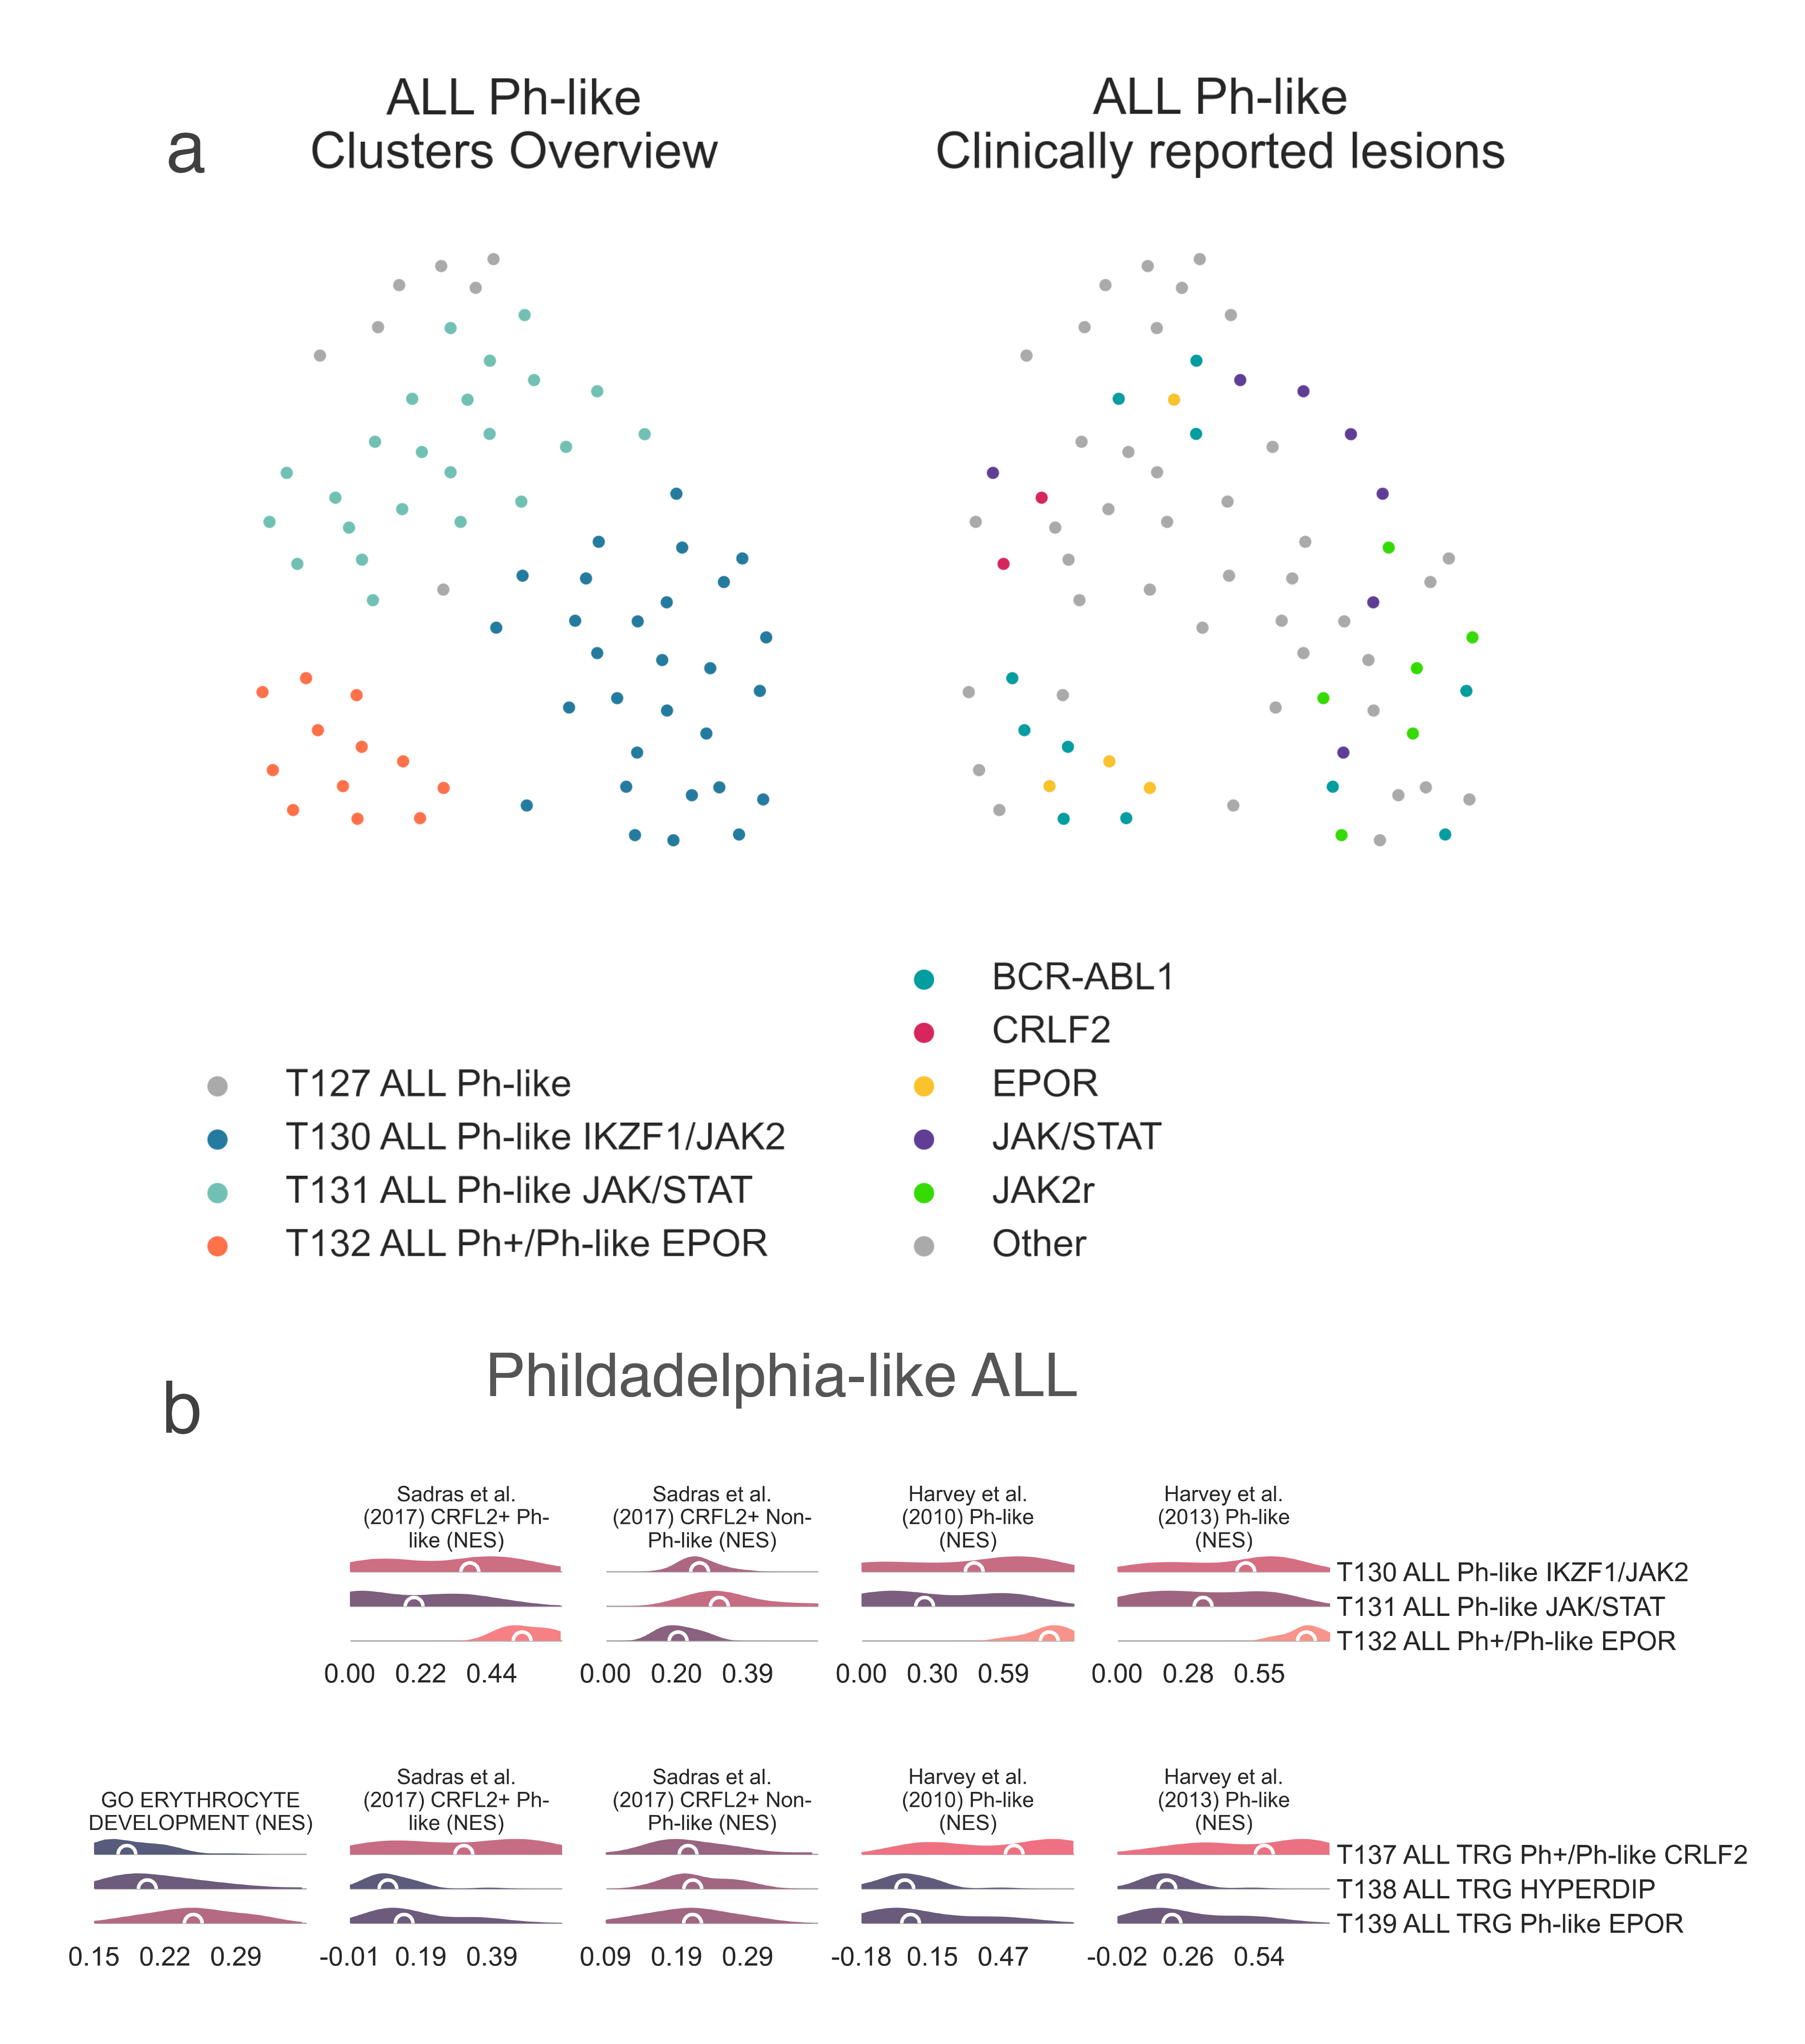
LEU3: A, 2-dimensional UMAP projection of acute lymphoid leukemia tumors by gene expression. On the left, subtypes are shown with different colours, on the right they are coloured by lesions reported by the presenting institution. B, Distribution plots of the expression of genes and gene sets relevant to the definition of the identified Ph-like lymphoblastic leukemia subtypes within the non-TARGET cohort (top) and the TARGET cohort (bottom).
Acute lymphoblastic leukemia, TARGET cohort
The TARGET ALL cluster, T124 ALL TRG, divides into four classes (Fig. LEU1b, LEU4)
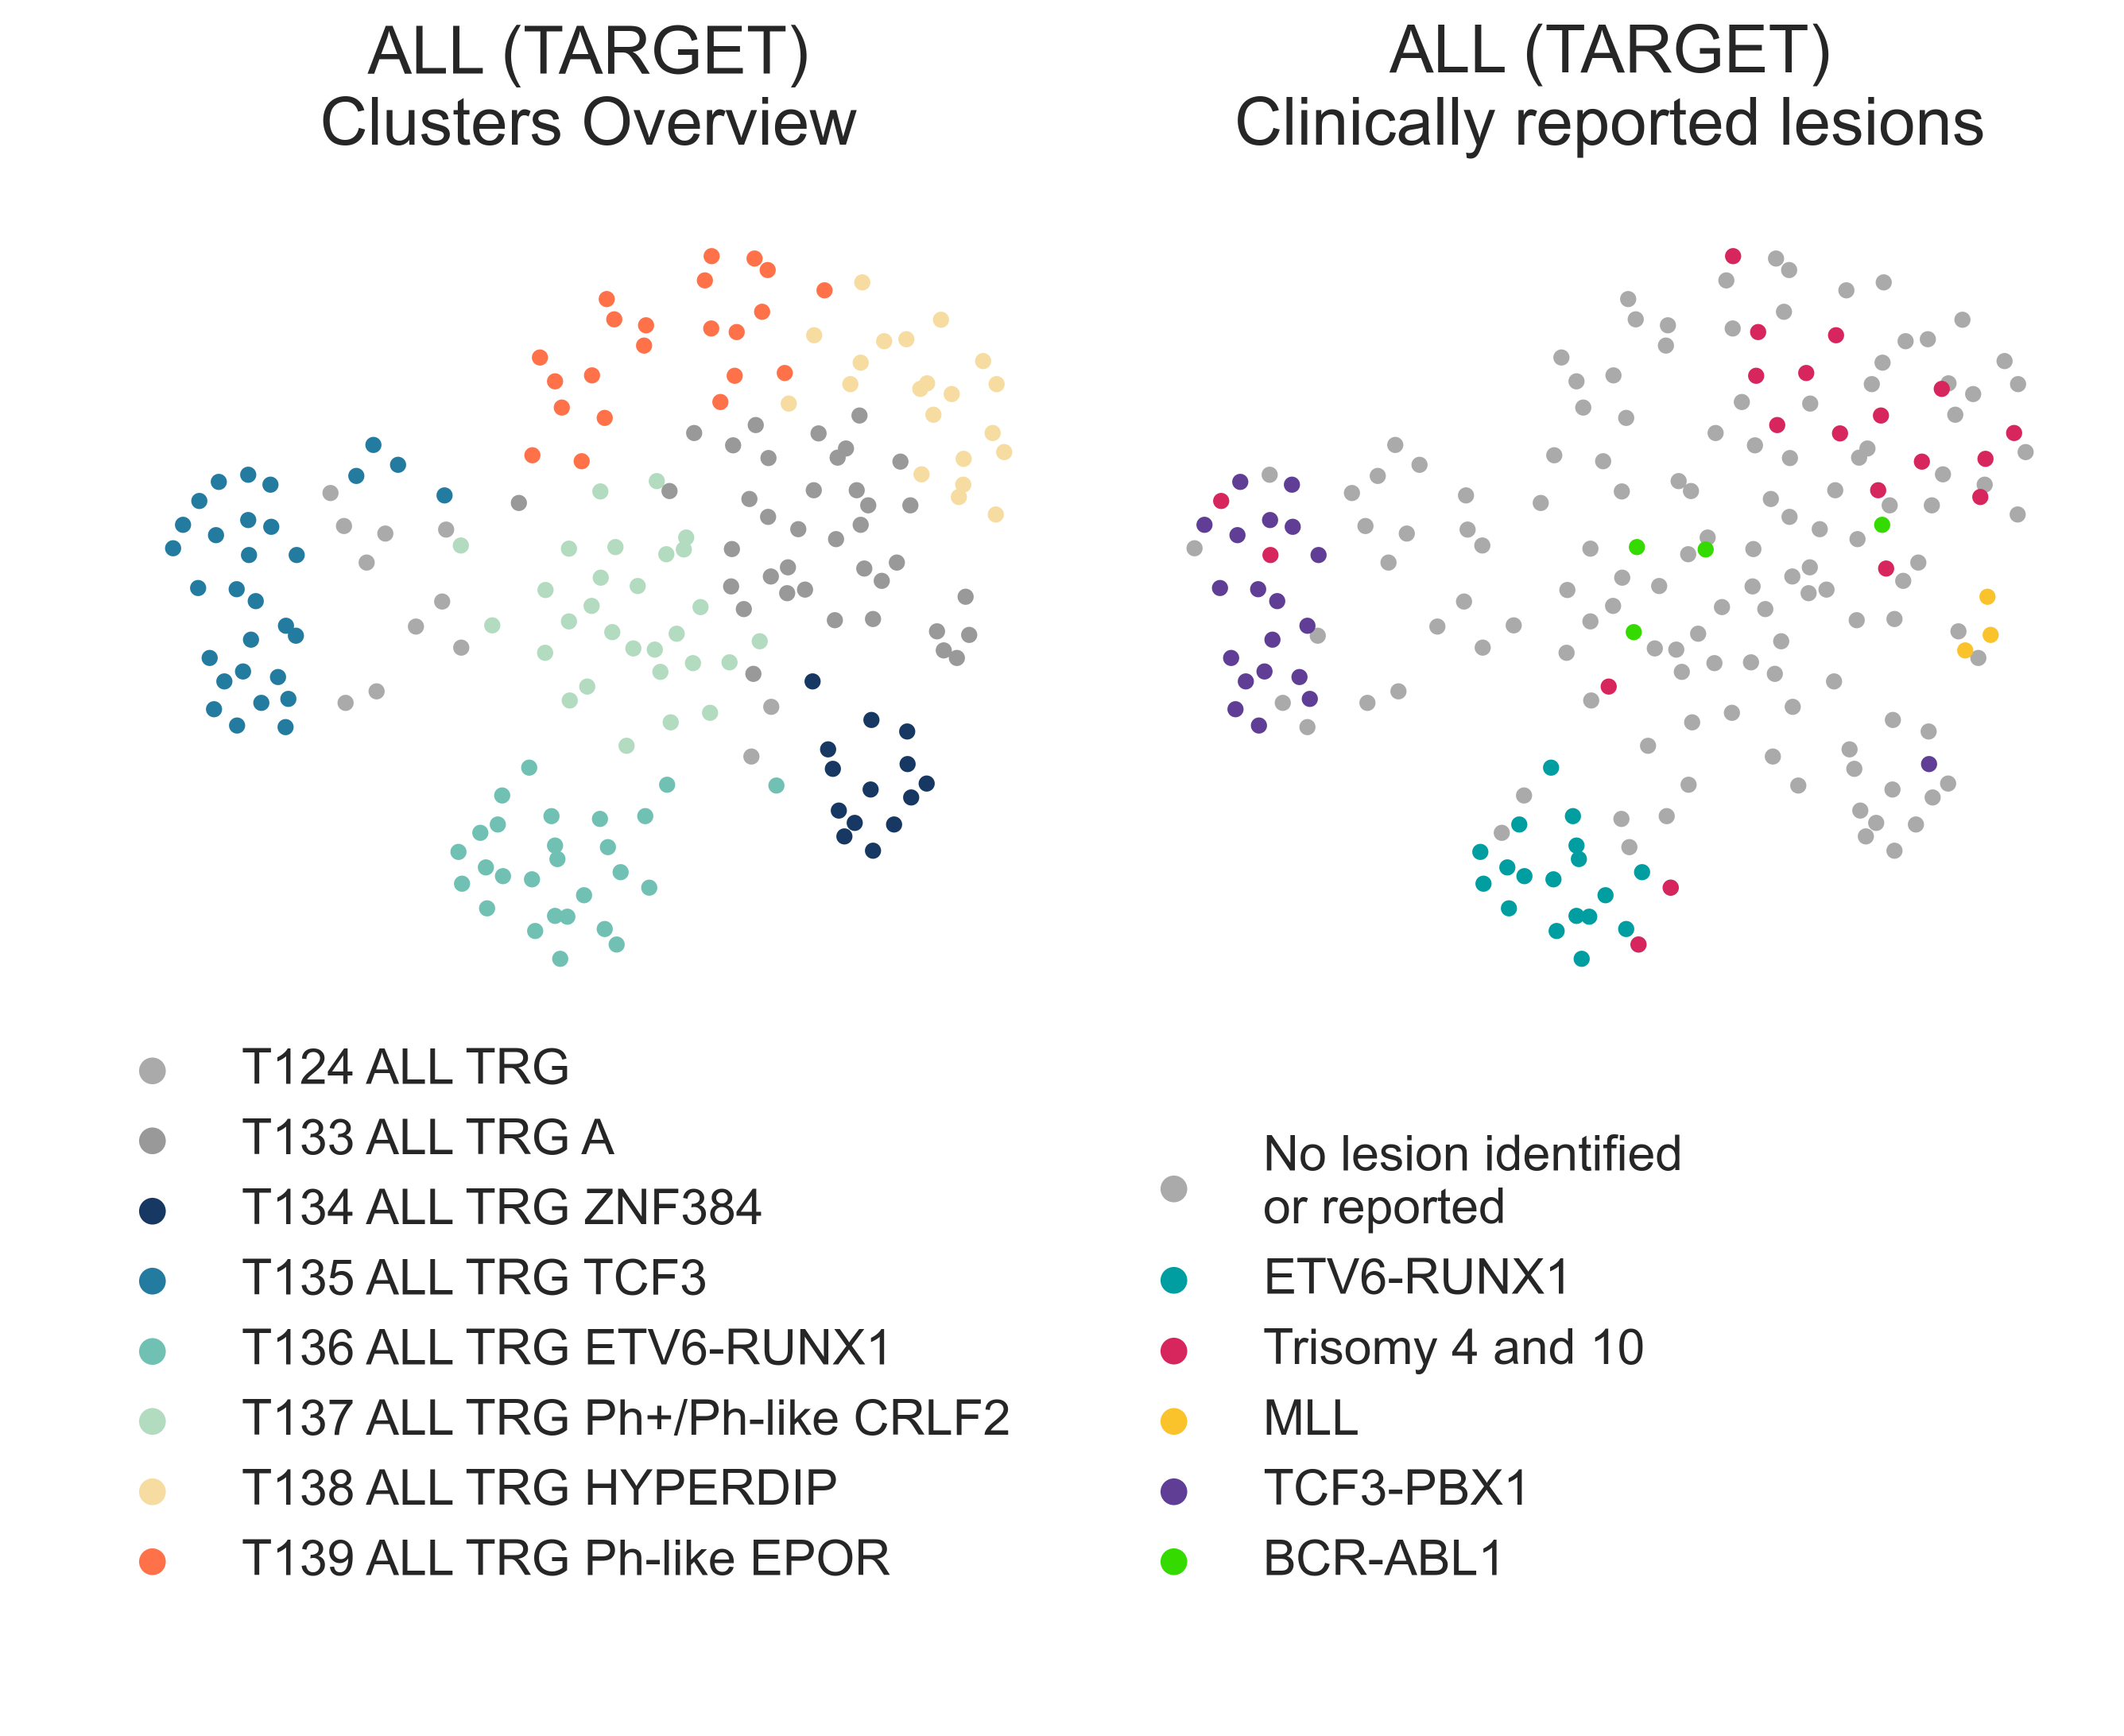
LEU4: 2-dimensional UMAP projection of acute lymphoid leukemia tumors from the TARGET cohort by gene expression. On the left, subtypes are shown with different colours, on the right they are coloured by lesions reported by the presenting institution.
T133 ALL TRG A (n = 109) is the largest cluster and contains a
mixture of genomic alterations: ALL with hyperdiploidy without trisomy of
chr4 and ch10 (χ2 p-val = 3.31e-4), ALL with
hyperdiploidy with trisomy chr4 and ch10, samples with iAMP21, plus a number of unspecified samples
(Fig. LEU4).
The cluster is characterized by significant overexpression of CRLF2 (logFC ≤ 7.749e-04).
Indeed, gene set enrichment analysis confirmed this cluster contains a sizeable population of
Ph+ and Ph-like samples (medNES = 79.08,
KW adj. p-val = 7.03e-14,
Dunn adj. p-val < 1.00e-03).
T134 ALL TRG ZNF384 (n = 13)
is the smallest cluster and contains the oldest group of patients (median age 13.23
y.o., KW adj. p-val = 1.13e-03).
Patients with ALL in this cluster display the best overall survival
(lrt p-val < 1e-04).
Gene set enrichment analysis of genes upregulated and downregulated in ZNF384-rearanged
ALL demonstrates a characteristic gene expression pattern of
ZNF384-fusion downstream targets, in both upregulated (medNES ≥ 1.51,
KW adj. p-val < 1.00e-04) and
donwregulated targets (medNES ≤ 4.81e-01,
KW adj. p-val < 1.00e-04), respectively [Qian2017], [Hirabayashi2017]
(Fig. LEU5).
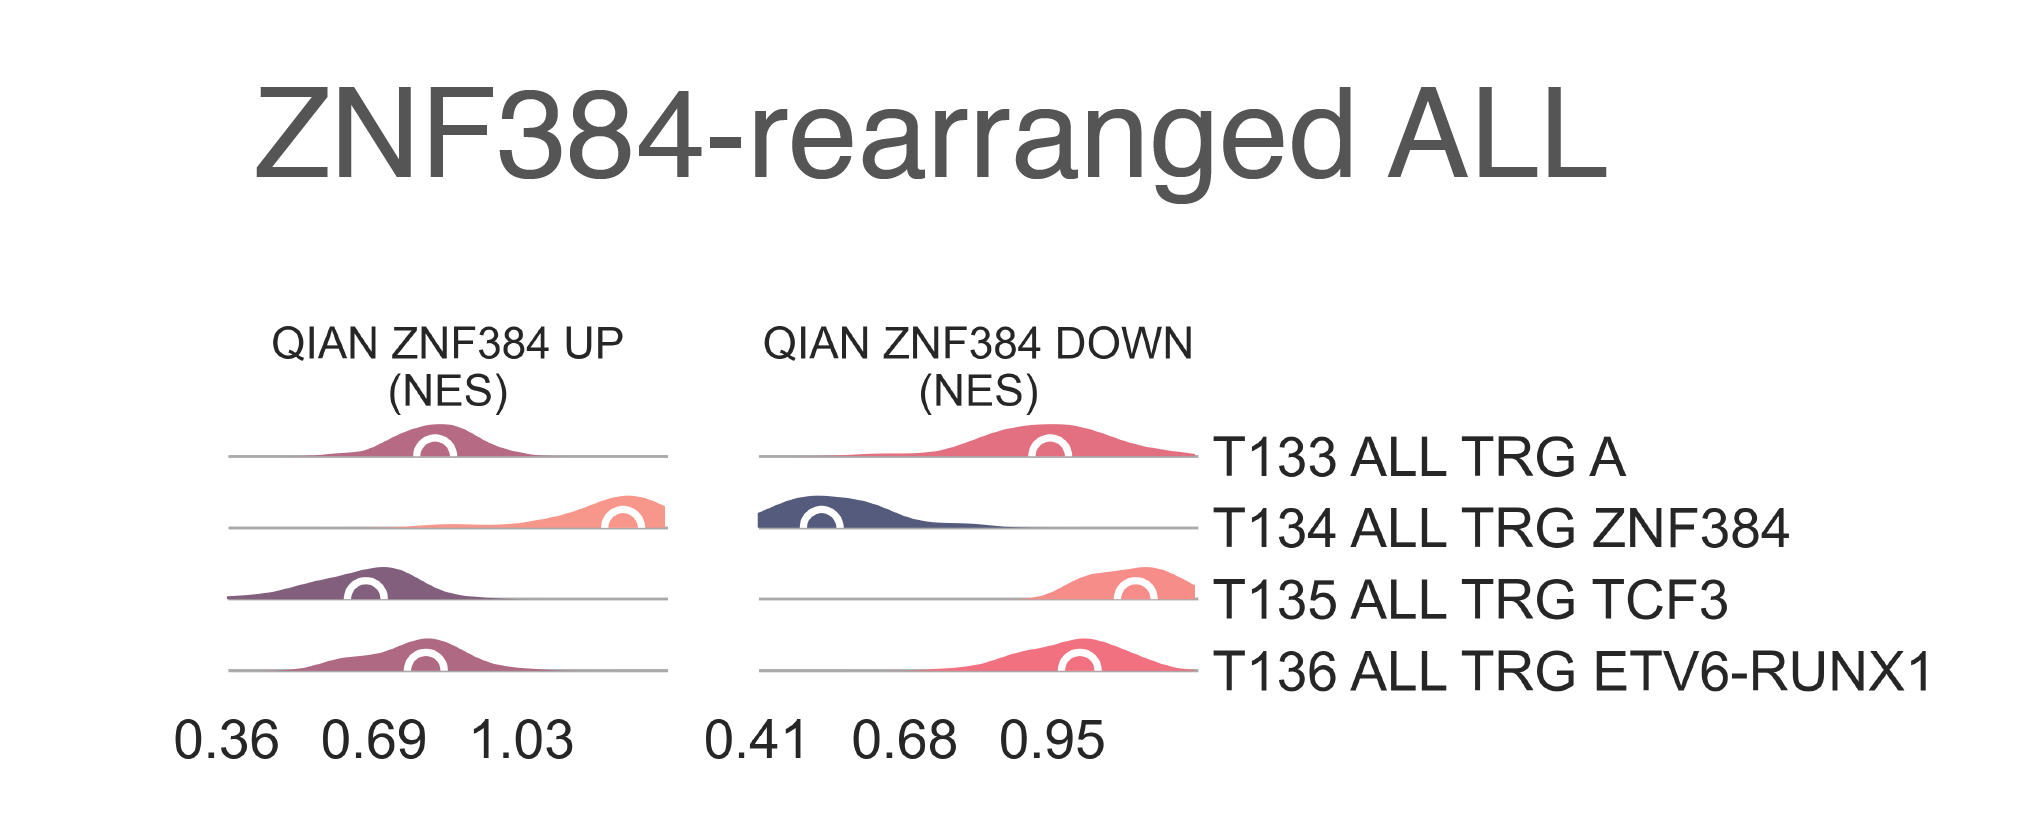
LEU5: Distribution plots of the expression of genes and gene sets relevant to the definition of the ZNF384A-rearranged lymphoblastic leukemia class.
T135 ALL TRG TCF3 (n = 30) is comprised of samples harbouring both
TCF3-PBX1 (n = 19, χ2 p-val < 2.2e-16) and TCF3-HLF (n = 3, χ2 p-val = 1.60e-02)
fusions.
Out of all TARGET ALL subgroups,
T135 ALL TRG TCF3 contains the patient group with the worst overall survival,
reaching median OS at 483 days (lrt p-val = 6.30e-22 at 4383 days,
post-hoc pairwise lrt p-val ≤ 1.5e-06).
When comparing patients with each fusion within this class, those with TCF3-HLF
fusions exhibit significantly worse OS (lrt p-val = 4.89e-02),
consistent with literature [Inukai2007].
Though identifying TCG3-HLF outright is important for determining clinical course due to
its negative prognostic indication [Inukai2007], due to a paucity of these samples we are unable to separate them further.
Due to transcriptional similarities, we also expect MEF2D-mutated samples would be clustered in this group [Ohki2019].
The final subclass of T124 ALL TRG,
T136 ALL TRG ETV6-RUNX1 (n = 27),
contains samples with ETV6-RUNX1 fusions (n = 20, χ2 p-val < 2.2e-16) (Fig. LEU4)
and comprises the youngest patients (median 3.1 y.o.,
KW adj. p-val = 1.13e-03).
T133 ALL TRG A separates in further components (Fig. LEU4).
T137 ALL TRG Ph+/Ph-like CRLF2 (n=29)
contains all samples labelled as harbouring BCR-ABL1 fusions (n = 3), MLL-rearranged ALL samples (n=3),
and the highest proportion of otherwise unspecified ALL samples (n = 23, χ2 p-val = 2.95e-05).
It shows overexpression of CRLF2 (logFC = 2.99, FDR = 1.48e-02)
nd enrichment of CRLF2-rearrangment signatures in Ph-like ALL (Ph+ CRFL2 positive,
medNES = 2.21, KW adj. p-val = 3.05e-03)
[Sadras2017] (Fig. LEU3b).
It also exhibits overexpression of IDH1 (logFC = 1.28, FDR = 3.66e-05),
JAK1 (FDR = 0.641, FDR = 4.15e-02)
and is enriched for Ph-like gene signatures (medNES = 2.88,
KW adj. p-val = 9.79e-06,
Dunn adj. p-val < 1.00e-03) [Harvey2010], [Harvey2013]
when compared to its siblings (Fig. LEU3b).
T138 ALL TRG HYPERDIP (n=21)
is enriched for tumors with hyperdiploidy without trisomy of both chromosomes 4 and 10
(1/29 vs. 11/20 vs. 7/22, χ2 p-val = 2.66e-04). Patients in
T138 are also significantly younger than its siblings (3.59 y.o.,
KW adj. p-val = 1.14e-02).
Furthermore, T138 exhibits the highest DNA index of its siblings, an indicator of hyperdiploidy
(median = 1.17, KW adj. p-val = 3.97e-07,
Dunn adj. p-val ≤ 4.18e-03) [Rachieru-Sourisseau2010].
T139 ALL TRG Ph-like EPOR (n = 22)
is characterized by overexpression of EPOR (median logFC = 2.06, FDR ≤ 1.20e-04),
as well as enrichment of erythrocyte developmental gene sets (medNES = 1.22,
KW adj. p-val = 2.06-06,
Dunn adj. p-val < 5.00e-02) [Ashburner2000], [TGOC2019].
It also exhibits overexpression of IDH2 (median logFC = 1.65, FDR ≤ 3.40e-11).
Acute Myeloid Leukemia
Myeloid malignancies in T120 AML immediately separate into 9 different classes at the following heirarchical level (Fig. LEU6). Similar to ALL, we observe two classes made up exclusively of TARGET samples: T144 AML TRG and T146 AML TRG IDH2low, which are discussed at the end of this section.
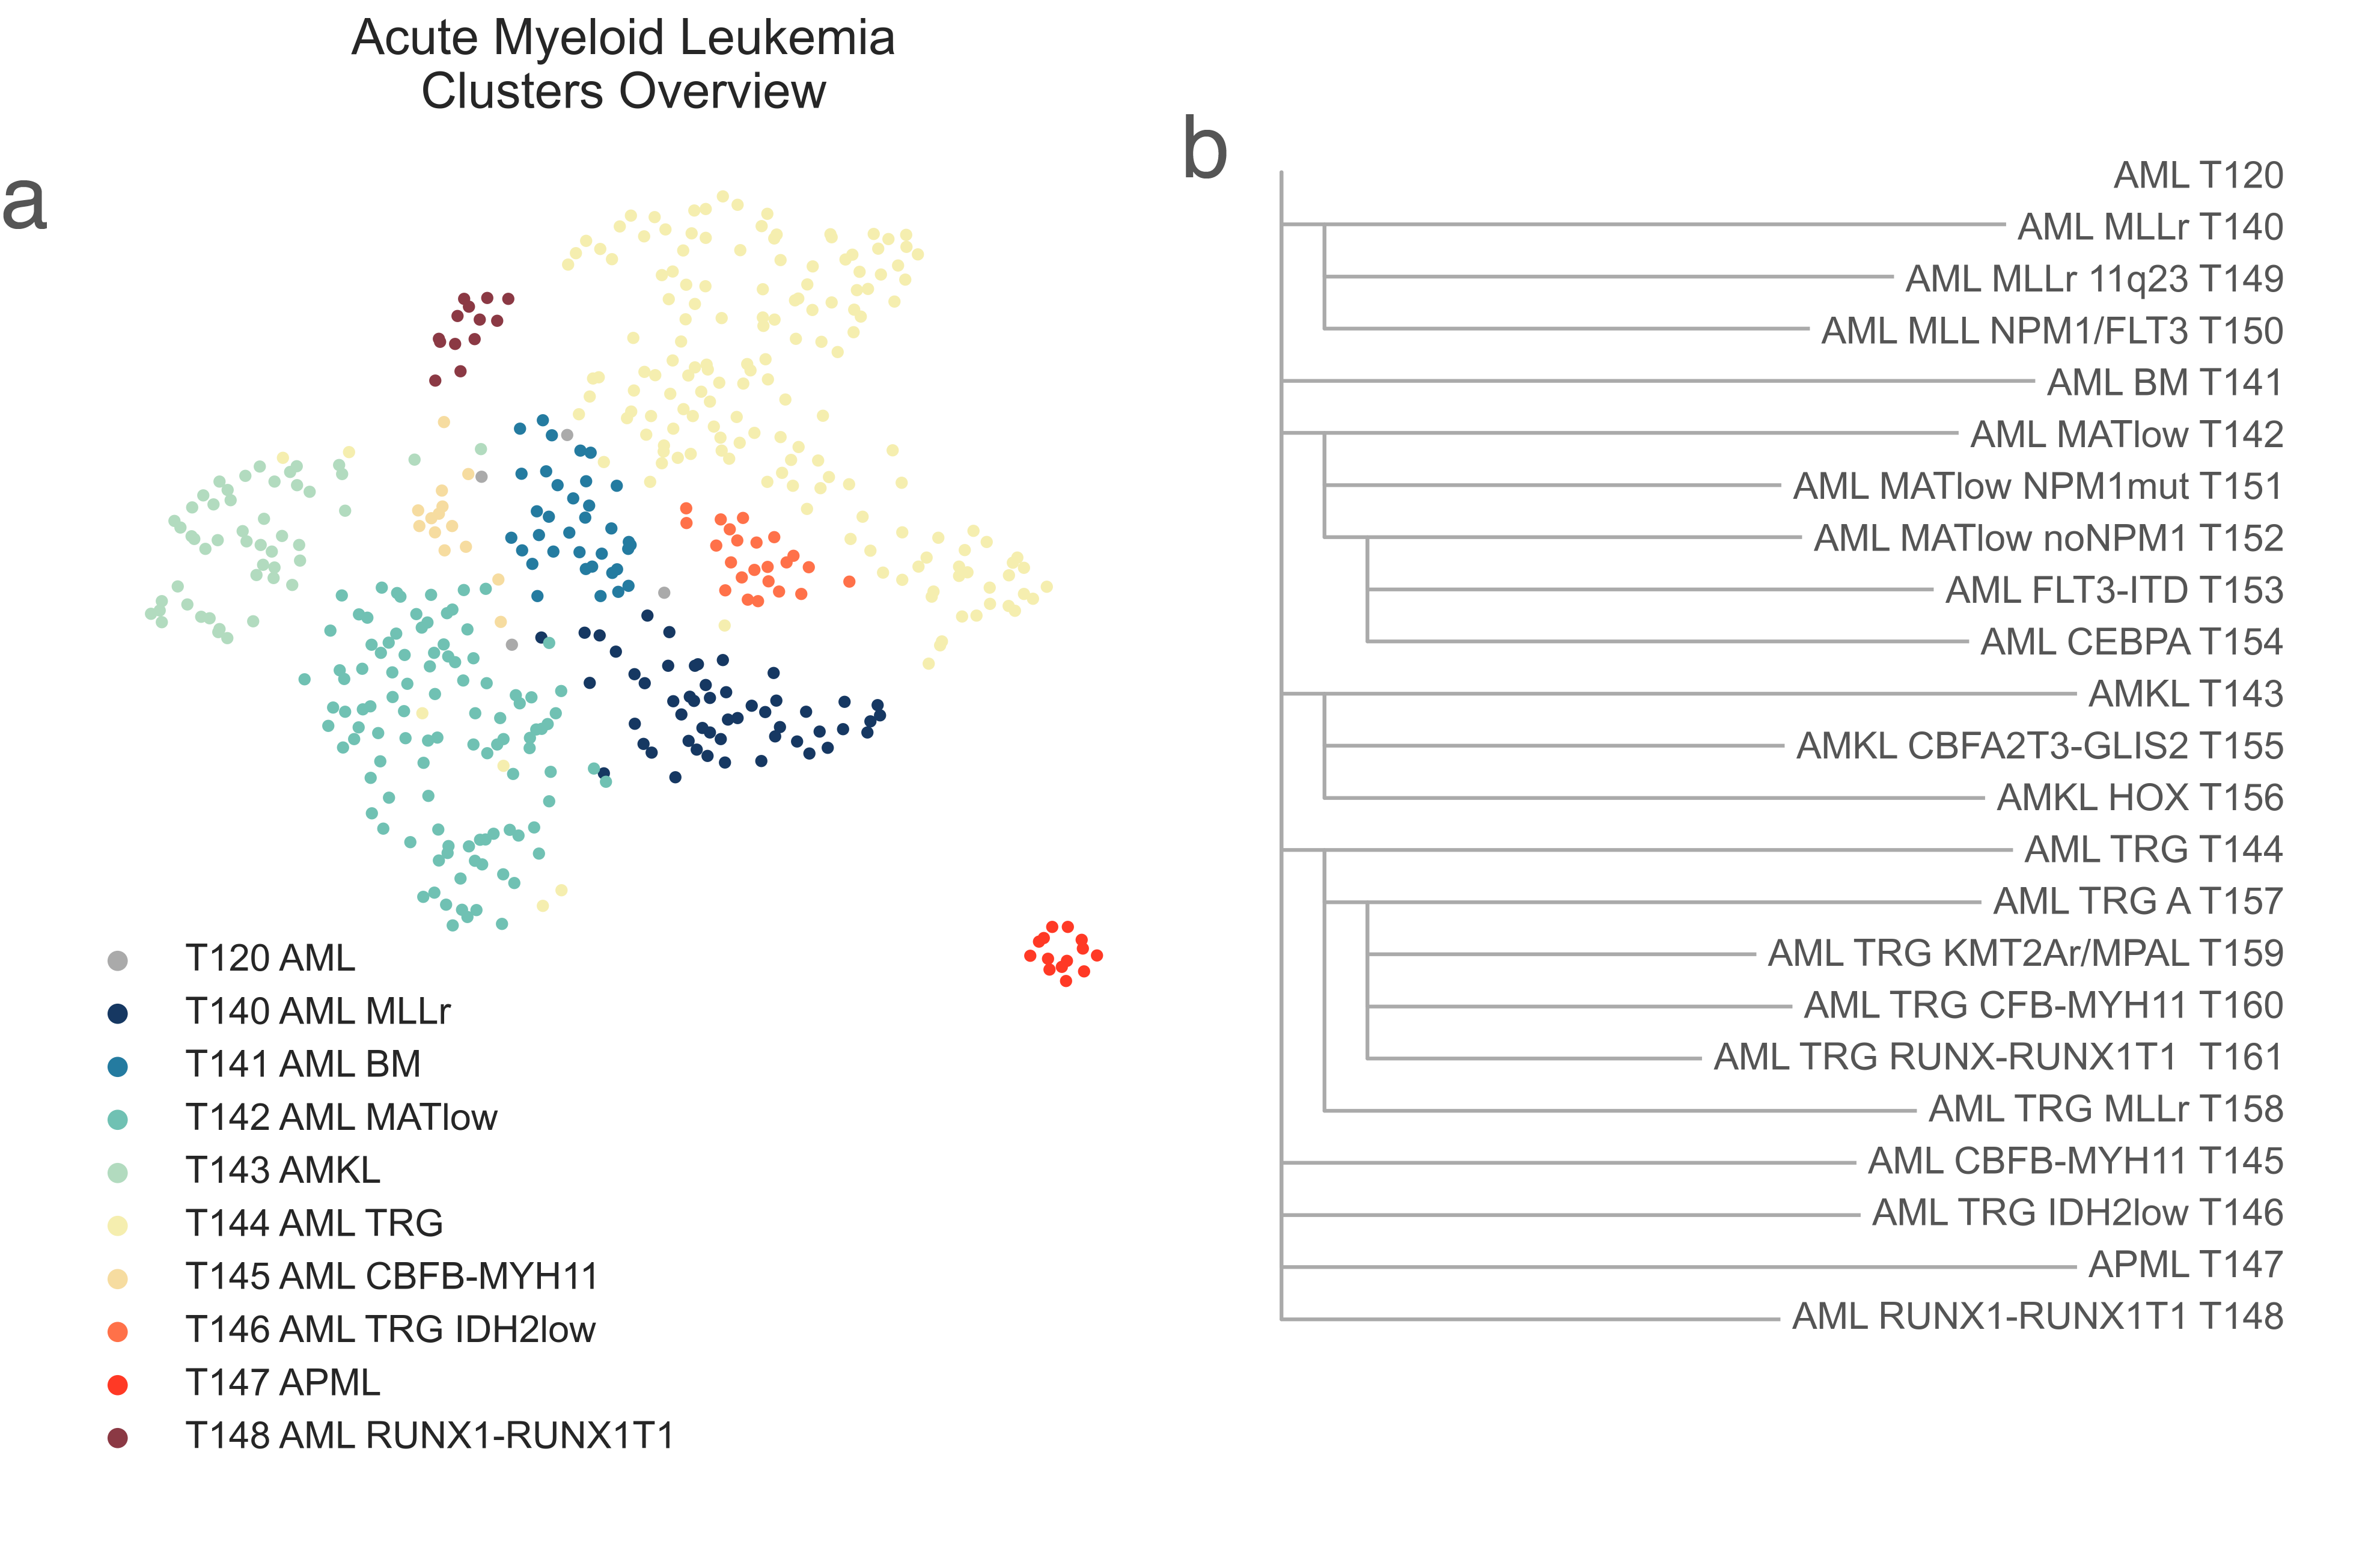
LEU6: A, 2-dimensional UMAP projection of acute myeloid leukemia tumors by gene expression. Subtypes at the third level of the hierarchy are shown with different colours. B, the list of all acute myeloid leukemia subtypes identified and their hierarchical relationship.
Acute Myeloid Leukemia, non-TARGET cohort
T140 AML KMT2Ar (n = 52) has a median age of 60.00 y.o (KW p-val =1.54e-48) due to the presence of 46/52 adult patients. It contains a number of samples marked for KMT2A fusions (most of them high risk, χ2 p-val = 4.45e-08), and is highly enriched (medNES > 1.08, KW adj. p-val < 1.00e-40, Dunn adj. p-val < 1.00e-04) for their matching pathways ([Ross2004]; [Mullighan2007]) (Fig. LEU7). It is also enriched for NPM1 mutated pathways (medNES = 1.07, KW adj. p-val < 1.00e-04) [Mullighan2007] suggesting a large cohort within this class may be NPM1 mutated. Indeed, all samples in this cluster for which we have NPM1 and FLT3 mutation data are mutated for either NPM1 (n=23) or FLT3 (n=16). This class displays poor OS (lrt p-val = 6.31e-11at 4022 days), reaching median OS at 327days.
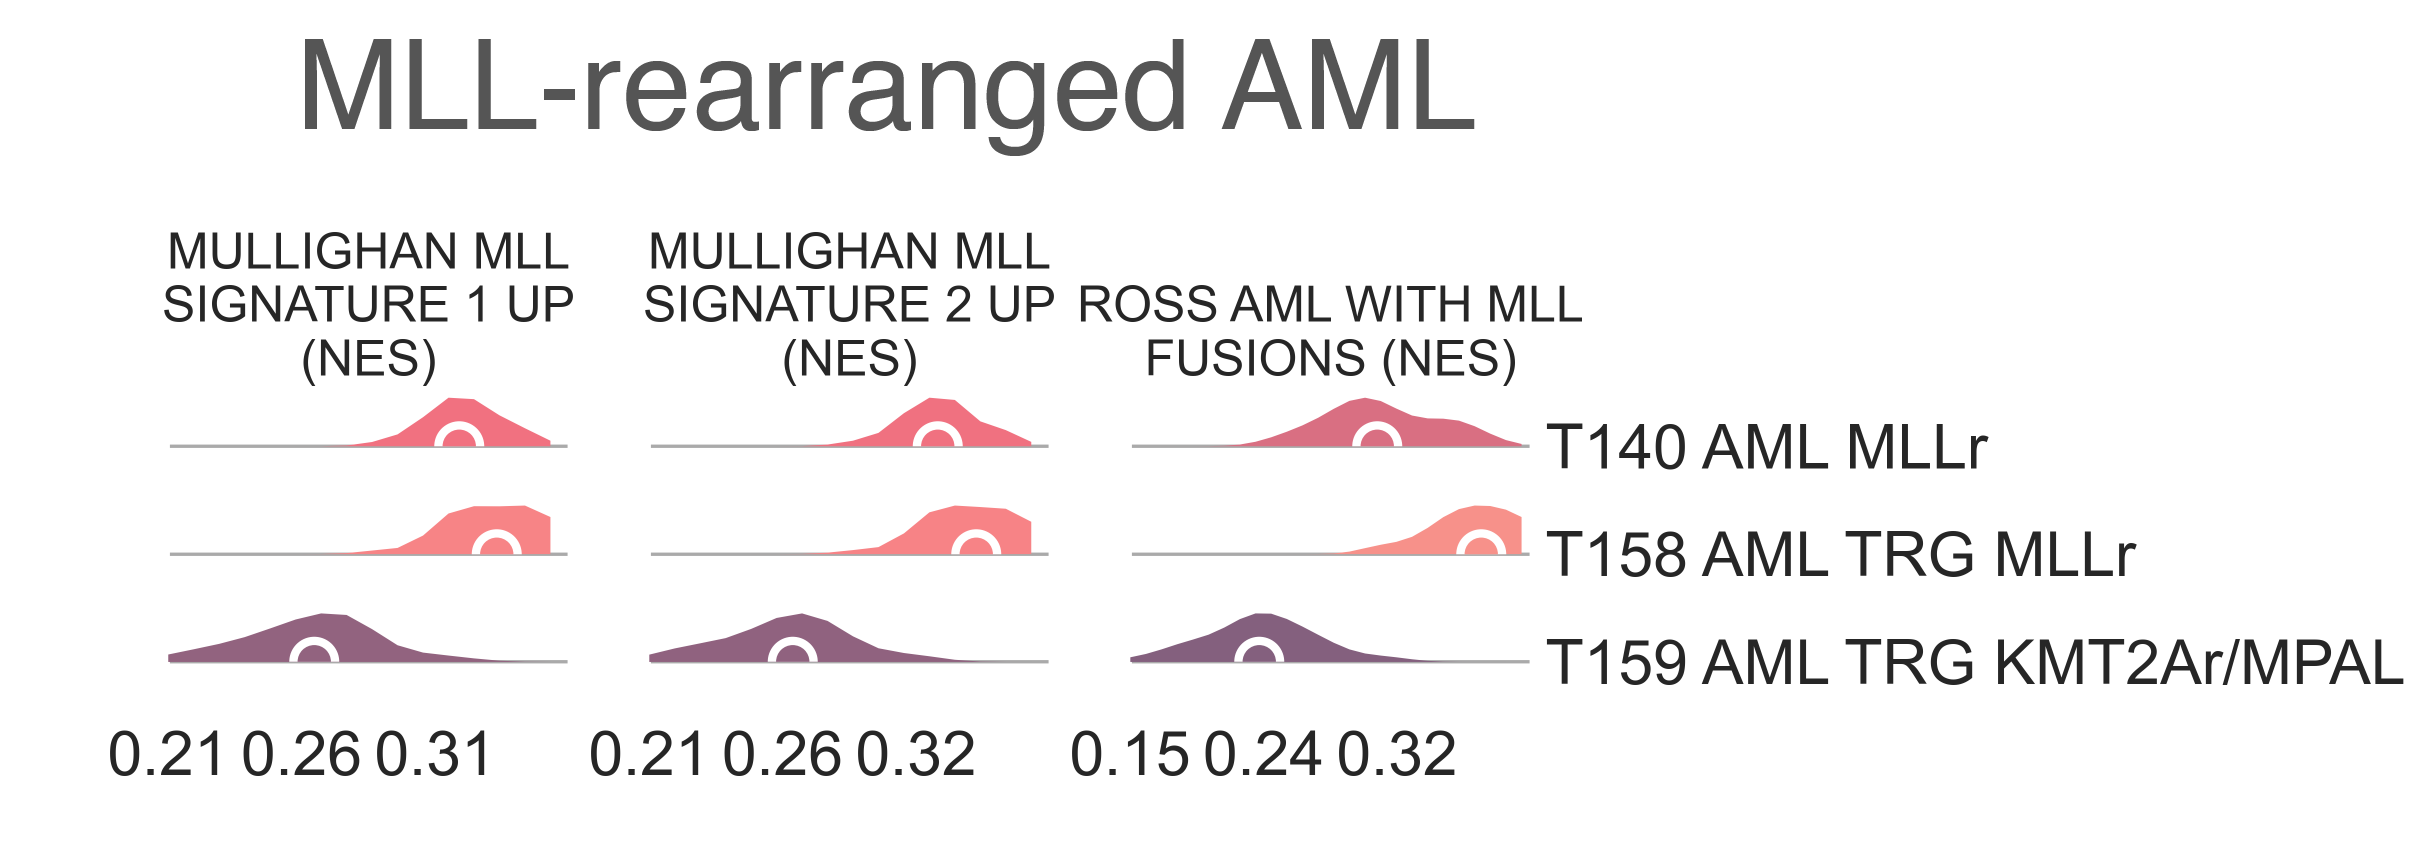
LEU7: Distribution plots of the normalized enrichment score of gene sets relevant to the definition of the KMT2A-rearranged myeloid leukemia class.
T140 AML KMT2Ar splits into two subclasses
(Fig. LEU6b). T149 AML KMT2Ar 11q23
(n = 8) is a very small cluster and is considerably younger (45.00 vs 62.00
MWU adj. p-val = 7.24e-03) than
T150 AML KMT2A NPM1/FLT3 (n = 44);
this is also reflected in the percentage of samples marked as pediatric (50.00% vs. 4.55%, χ2 p-val = 7.25e-03).
While 5 samples are marked as AML,
T149 AML KMT2Ar 11q23 also contains
3 samples marked as mixed lineage leukemias (χ2 p-val = 7.79e-04).
It contains 4 samples from TCGA, all of which are annotated with
KMT2A fusions (two MLL10-KMT2A and one KMT2A-MLLT3 and one KMT2A-MLLT4), while
T150 AML KMT2A NPM1/FLT3
contains 40 samples from TGCA, 10 of which have reported gene fusions, with seven involving KMT2A genes.
When compared to T150 AML KMT2A NPM1/FLT3 ,
T149 AML KMT2Ar 11q23 is significantly
enriched for genes sets involving chr11q23 rearrangement (medNES = 8.46,
KW adj. p-val = 1.06e-08) [Yagi2003]
and AML cluster 16 from Valk et al. 2004 (medNES = 4.03, adj. p-val = 2.66e-09),
which is composed of samples with 11q23 rearrangements [Valk2004].
T150 AML KMT2A NPM1/FLT3
inherits all of the NPM1 and FLT3 mutants found in its parent
T140 AML KMT2Ar [Braoudaki2010],
and is enriched for their corresponding gene sets (medNES =2.34,
KW adj. p-val =7.97e-08,
medNES = 1.85,
KW adj. p-val = 1.25e-04, respectively) [Valk2004], [Verhaak2009].
T141 AML BM (n = 30) is a mixed-lineage cluster.
It comprises myeloid, megakaryoblastic, non-specific, and lymphoblastic leukemias along with a few lymphomas and osteosarcomas.
It is not enriched for any leukemia associated gene sets, suggesting this class may contain samples contaminated by normal blood or bone marrow tissue.
T142 AML MATlow (n = 105) is largely composed of FAB subtypes M1
(n = 33, χ2 p-val = 7.44e-04), AML with minimal maturation,
and M2 (n = 34, χ2 p-val = 1.60e-06), AML with maturation,
and a smaller subpopulation of undifferentiated M0 (n = 15, χ2 p-val = 1.15e-04).
It is composed of older patients, with a median age of 57 y.o, and is enriched for samples classified as intermediate
(n = 54, χ2 p-val = 1.43e-07) and high-risk (n = 37, χ2 p-val 1.61e-09).
It contains two BCR-ABL1 fusion samples, 24 FLT3 mutants - all of which are from the TCGA,
though the mutations themselves are heterogenous – 24 NMP1 mutants, 21 of which are W288F (χ2 p-val < 2.2e-16),
along with 9 WT1 mutants (χ2 p-val = 1.56 e-4).
All samples in this cluster for which we have NPM1 and FLT3 mutation data have mutations in either gene.
This cluster displays intermediate low prognosis, reaching median OS at 417 days
(lrt p-val = 6.31e-11 at 4022 days).
T142 AML MATlow splits into two two subclasses,
T151 AML MATlow NPM1mut and
T152 AML MATlow noNPM1 (Fig. S26b),
which are separated by the presence or absence of NPM1 mutations, as well as karyotypic complexity.
T151 AML MATlow NPM1mut (n = 34) has a
higher ratio of FAB M1 samples, AML with minimal maturation,
(16/32 vs 17/62, FET p-val = 4.04e-02) and inherits all NPM1-mutant
samples except for one, a p.K263R (χ2 p-val = 6.67e-13); all samples for which we have
NPM1 data within this cluster (n=25) are NPM1 mutated.
As expected, we confirmed this annotation through significance (medNES = 1.25,
MWU adj. p-val = 7.83e-16) in NPM1 mutation pathways [Mullighan2007].
Its sibling, T152 AML MATlow noNPM1 (n = 71),
has a higher proportion of FAB M0 samples, undifferentiated AML
(1 vs. 14, FET p-val = 3.21e-02), and possibly contains equivalent samples
without NPM1 mutation.
M2 samples are evenly split between the clusters (χ2 p-val = 6.51e-01), suggesting
maturation is not a critical determinant of this split. Samples with FLT3 and WT1 mutations are more common in
T151 AML MATlow NPM1mut than in
T152 AML MATlow noNPM1, confirmed by gene
sets for FLT3 mutation (medNES = 1.90,
MWU adj. p-val = 2.29e-13) [Valk2004].
We observe no significant separation in survival between the two clusters.
T152 AML MATlow noNPM1 further splits into
T153 AML FLT3-ITD (n = 58) and
T154 AML CEBPA (n = 13) (Fig. S26b). There is a significantly age
desparity between patients in these clusters (63 vs 32 y.o.
MWU adj. p-val = 7.80e-05).
T153 AML FLT3-ITD contains all M0 samples
(n = 14 vs 0) while T154 AML CEBPA is enriched for FAB M2 samples
(n = 12 vs 9, χ2 p-val = 3.81e-03).
T153 AML FLT3-ITD also contains five acute
megakaryoblastic leukemias and two mixed lineage leukemias, and carries more samples with complex cytogenetics
(χ2 p-val < 1.00-03) and has significantly reduced
OS (lrt p-val = 2.00e-02).
In line with findings described in literature,
T153 AML FLT3-ITD exhibits a
higher mutation burden (median = 17.00 vs. 8.50, MWU adj. p-val = 2.06e-03),
which is largely related to age in AML [Shaver2015].
T153 contains six FLT3 mutant samples (three of which have in frame insertions), while T154 AML CEBPA
contains only one. T153 AML FLT3-ITD overexpresses
a myriad of genes (21/39, FDR < 0.05), which are known to be upregulated in samples
harbouring FLT3 internal tandem duplications (FLT3-ITD), as well as enrichment of
FLT3-ITD gene sets
(medNES = 3.11,
KW adj. p-val contains
only three CEBPA mutated samples, while T154 AML CEBPA contains
eight (χ2 p-val = 3.28e-06)
The direct subclusters of T120 AML continue here.
T143 AMKL (n = 49) is exclusively composed of
megakaryoblastic samples (n = 41, χ2 p-val < 2.20e-16) while eight samples
are unlabelled, and as expected is enriched for AMKL
pathways (medNES ≥ 1.70 ,
KW adj. p-val at 313 days (lrt p-val = 6.31e-11).
T143 AMKL then splits into T155 AMKL CBFA2T3-GLIS2
(n = 12) and T156 AMKL HOX (n = 37).
Though both are entirely pediatric, the former cluster contains significantly younger patients (median age of 0.97 vs 2.17
y.o. ,:abbr:MWU adj. p-val (Mann Whitney U test Benjamin-Hochberg adjusted p-value) = 2.08e-02).
All samples in T155 AMKL CBFA2T3-GLIS2 for which genomic
data are available are characterized by a CBFA2T3-GLIS2 fusion (9/9 vs. 0/25, χ2 p-val = 7.03e-08) [deRooij2017].
Patients in T155 AMKL CBFA2T3-GLIS2 have poorer prognsosis,
reaching median OS at just 313 days post diagnosis. T156 AMKL HOX is composed of other driver events: two GATA1 mutants , four HOXr (HOX fusion) samples, eight KMT2A-MLLT3/10 fusions, four NUP98-KDM5A fusions, two RBM15-MKL1 fusions, and four samples with other driver mutations.
With a greater sample size its possible these mutations would form their own clusters as well. When comparing these
two classes, T156 AMKL HOX exhibits overexpression of
HOXA (11/11 genes upregulated, median logFC ≤ -5.67, FDR ≤ 8.47e-03 )
and HOXB genes (8/10 upregulated, median logFC = -5.65, FDR ≤ 7.31e-03) [deRooij2017].
The remaining subclasses of T120 AML are defined by clear fusion events. All samples
within T145 AML CBFB-MYH11 (n = 14) are marked as core binding factor positive, CBFB-MYH11.
As expected, it is enriched (medNES ≥ 1.35 ,
KW adj. p-val (n = 15), except for one, are positive for
PML-RARA fusions (χ2 p-val < 2.20e-16) and marked as FAB M3
(χ2 p-val < 2.20e-16), acute promyelocytic leukemia.
This class also contains 5 samples with FLT3 mutations, four of which are p600 in frame insertions
(from TCGA); these seem to be exclusive to this cluster.
This class has the best prognosis of the cohort, with >60% of patients surviving at 4022 days post diagnosis.
The final child of T120 AML,
T148 AML RUNX1-RUNX1T1 (n = 13), exclusively contains
RUNX1-RUNX1T1 fusion AML (χ2 p-val < 2.20e-16).
It has moderate-good prognosis, reaching median OS 2910 days.
Acute Myeloid Leukemia, TARGET cohort
We observe two classes within the AML branch with an exclusive TARGET composition (Fig. LEU6). T146 AML TRG IDH2low (n = 23) is composed by samples with various diagnostic categories: three KMT2A fusions (n =3), eight normal karyotypes, and 10 other lesions, including two t(X;10)(p11.2;p11.2), add(17)(p11.2) and two inv(17)(p13.1q11.2), both exclusive to this group. However, it contains the highest proportion of WT1 mutations (7/23, χ2 p-val = 1.39e-3) and FLT3-ITDs (8/23, χ2 p-val = 2.427e-05) amongst the TARGET cohort. It also exhibits the lowest expression of IDH2 (logFC = -0.836, p-val = 2.58e-2 against T155-T159 and T161 AML TRG RUNX-RUNX1T1). This group displays intermediate prognosis, reaching median OS at 1394 days post diagnosis.
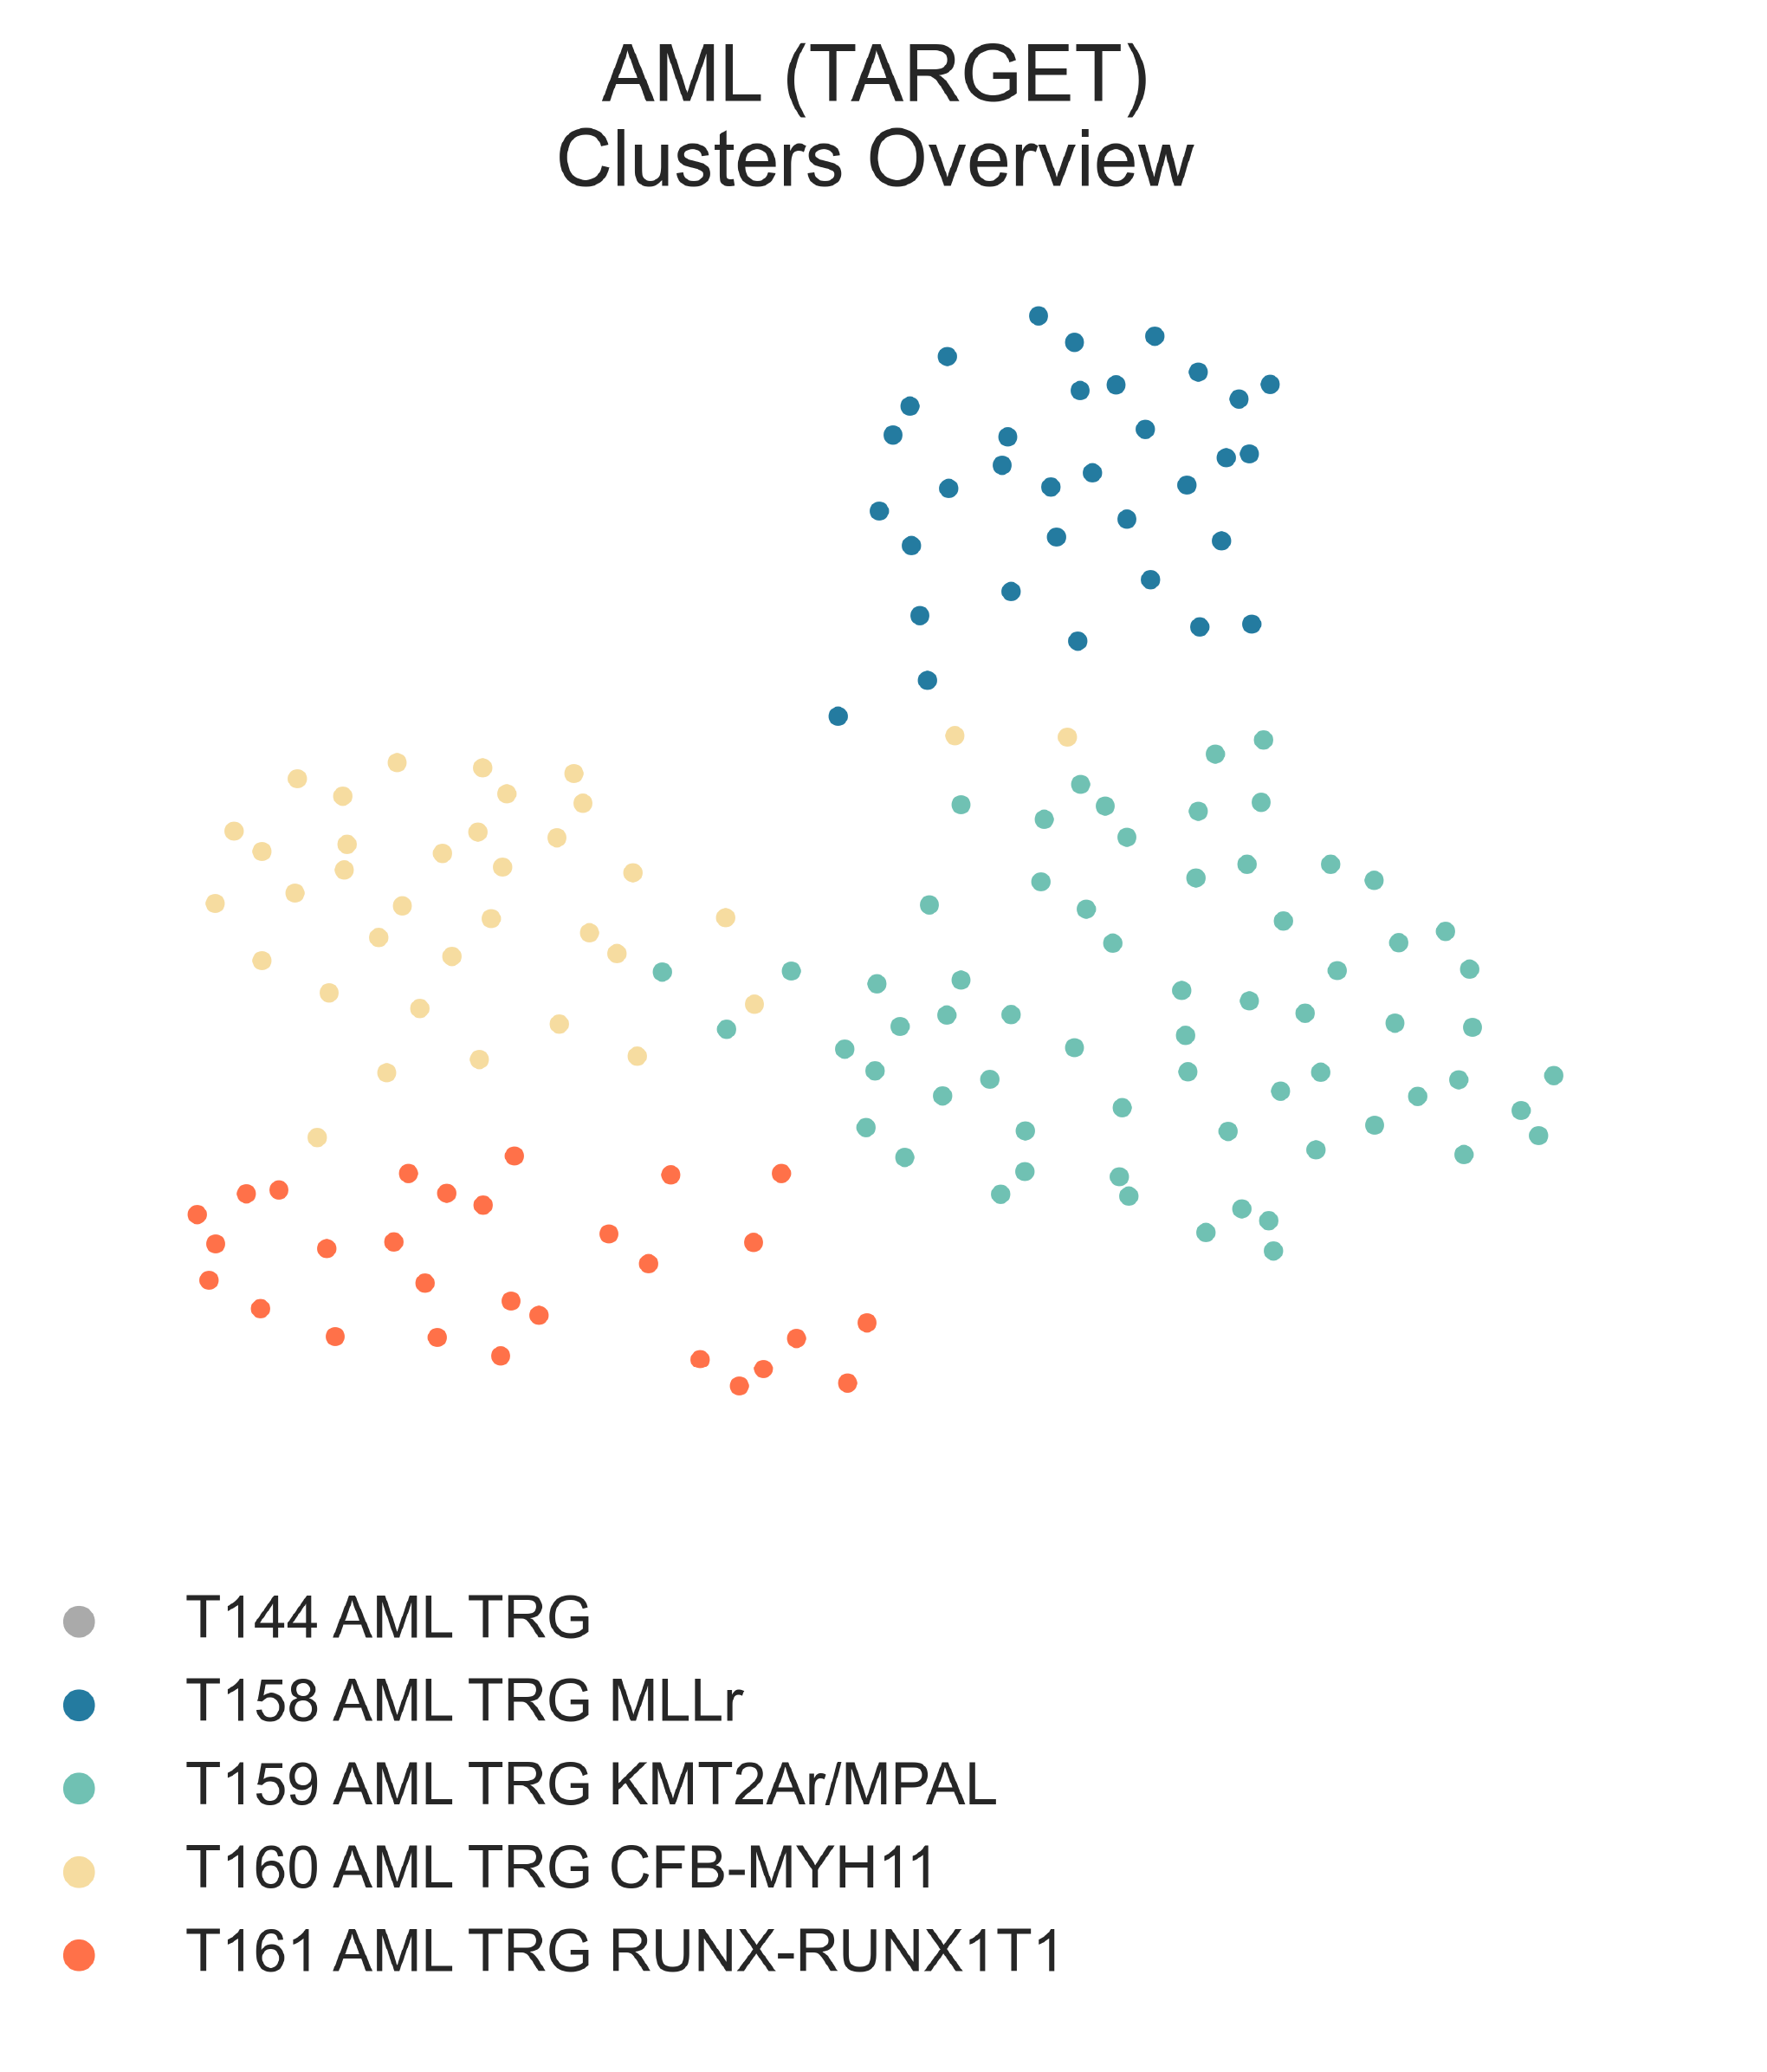
LEU8: 2-dimensional UMAP projection of acute myeloid leukemia tumors from the TARGET cohort by gene expression. Subtypes at the third level of the hierarchy are shown with different colours.
T144 AML TRG (n = 163) is the largest subcluster of T120 AML and is composed
largely of unspecified AML (n=154), and surprisingly contains 5
ALL. It is an entirely pediatric cluster
(median age 9.36 y.o.) and has excellent prognosis, with >50% of patients surviving at 4022 days post diagnosis.
Diving deeper into this class (Fig. S26b, c), we observe first the singling out of AML
with KMT2A translocations (23/33 vs 12/120, χ2 p-val = 2.623e-12) in
T158 AML TRG KMT2Ar (n = 33) from all
other samples in T157 AML TRG A (n = 130).
As expected, T158 AML TRG KMT2Ar shows
enrichment (MWU adj. p-val ≤ 1.00e-03)
of KMT2A-associated gene sets [Ross2004], [Mullighan2007]. There is no difference in OS between the two subclasses.
We then observe T157 AML TRG A splitting into three small
subclasses characterized by unique molecular aberrations:
T159 AML TRG KMT2Ar/MPAL (n = 65),
T160 AML TRG CFB-MYH11 (n = 36),
and T161 AML TRG RUNX-RUNX1T1 (n = 29).
Aside from myeloid malignancies,
T159 AML TRG KMT2Ar/MPAL
contains 4 ALL samples, one unspecified leukemia and one lymphoma.
It has the highest proportion of intermediate risk samples (n = 36, χ2 p-val = 1.581e-06)
and patients within it exhibit a significantly worse OS than either of its siblings
(lrt p-val = 2.20e-04). This cluster also inherits all NPM1 mutant samples, while
FLT3-ITD and WT1 mutants are spread across all three clusters.
This class also contains samples labelled as KMT2A-rearranged (n = 11/56, χ2 p-val = 4.103e-03).
It shows overexpression of a wide variety of HOX genes (24/39 HOX genes with median
logFC > 0 & FDR < 0.05, 22/39 FDR < 1e-04, median
logFC = 4.62), a phenotype previously described in AMLs with KMT2A partial internal tandem duplication (KMT2A-PTD) [Dorrance2006].
The characteristic expression patterns of KMT2A-PTD
could explain the inclusion of a handful of ALL samples, which may also
harbour non-canonical KMT2A aberrations.
Indeed, manual inspection of a subsample of eight mRNA sequences (five labelled as AML,
three as ALL) from TARGET revealed the majority of these samples (4/8) harbour
complex lesions in KMT2A or (2/8) with rearrangments to exon 7 and 8 associated with KMT2A-PTD.
The transcriptional profile of KMT2A lesions in this class departs from that most commonly described by literature,
as most gene sets involving KMT2A mutated leukemias agree an impoverishment in this class when compared to the
bona-fide KMT2A-rearranged AML class
T158 AML TRG KMT2Ar
(medNES ≥ 1.27 for positive signatures in T158 AML TRG KMT2Ar,
≥ 1.61 for negative signatures in T159 AML TRG KMT2Ar/MPAL, MWU adj. p-val ≤ 3.32e-15) ([Ross2004]; [Mullighan2007];).
A single sample harbours a BSG-CDC34 fusion. While no KMT2A mutation was reported, CDC34 is known to mediate stability and degradation of
KMT2A ([Meyer2018]; [Sugeedha2021]), supporting the idea that
T159 AML TRG KMT2Ar/MPAL
is composed of tumors with various lesions which converge upon KMT2A pathway pertubation.
KMT2A rearrangements are also common in mixed phenotype acute leukemias (MPAL) [Winters2017], [Yang2017];
to assess whether some of these samples are MPAL, we interrogated a number of gene sets (Fig. LEU9).
Indeed, MPAL expression sets were significantly upregulated in
AML within
T159 AML TRG KMT2Ar/MPAL
when compared to all other AML in T120 AML
(medNES = 1.20, MWU adj. p-val = 2.94-12),
which in turn have higher markers of AML vs MPAL
(medNES = 1.04, MWU adj. p-val = 5.55e-05) [Bian2018].
Furthermore, these samples carry higher lymphocyte differentiation expression than AML
from their family class (T159 AML TRG KMT2Ar/MPAL
vs T120 AML, medNES = 2.63,
MWU adj. p-val = 1.36e-03) [The2019], [Ashburner2000].
In turn, the four ALL samples within this same class have significant enrichment
for myeloid differentiation when compared to all other ALL in
T119 ALL (medNES = 1.25,
MWU adj. p-val = 9.01e-04) [The2019], [Ashburner2000].
Furthermore, we report enrichment of T-cell development and differentiation gene sets when comparing
samples of matching reported lineage to either T120 AML
(medNES ≥ 1.10, MWU adj. p-val ≤ 9.82e-08)
and T119 ALL (medNES ≥ 1.27,
MWU adj. p-val ≤ 2.77e-02) [The2019], [Ashburner2000],
composed exclusively of B-cell ALL (Fig. LEU9).
These results support the hypothetical presence of T-cell MPAL within
T159 AML TRG KMT2Ar/MPAL.
While limited information is given by the labelling of these samples, we can confidently speculate this class includes
KMT2A-rearranged B-cell and/or T-cell MPAL, or at the very least samples of either
linage expressing both myeloid and lymphoid markers.
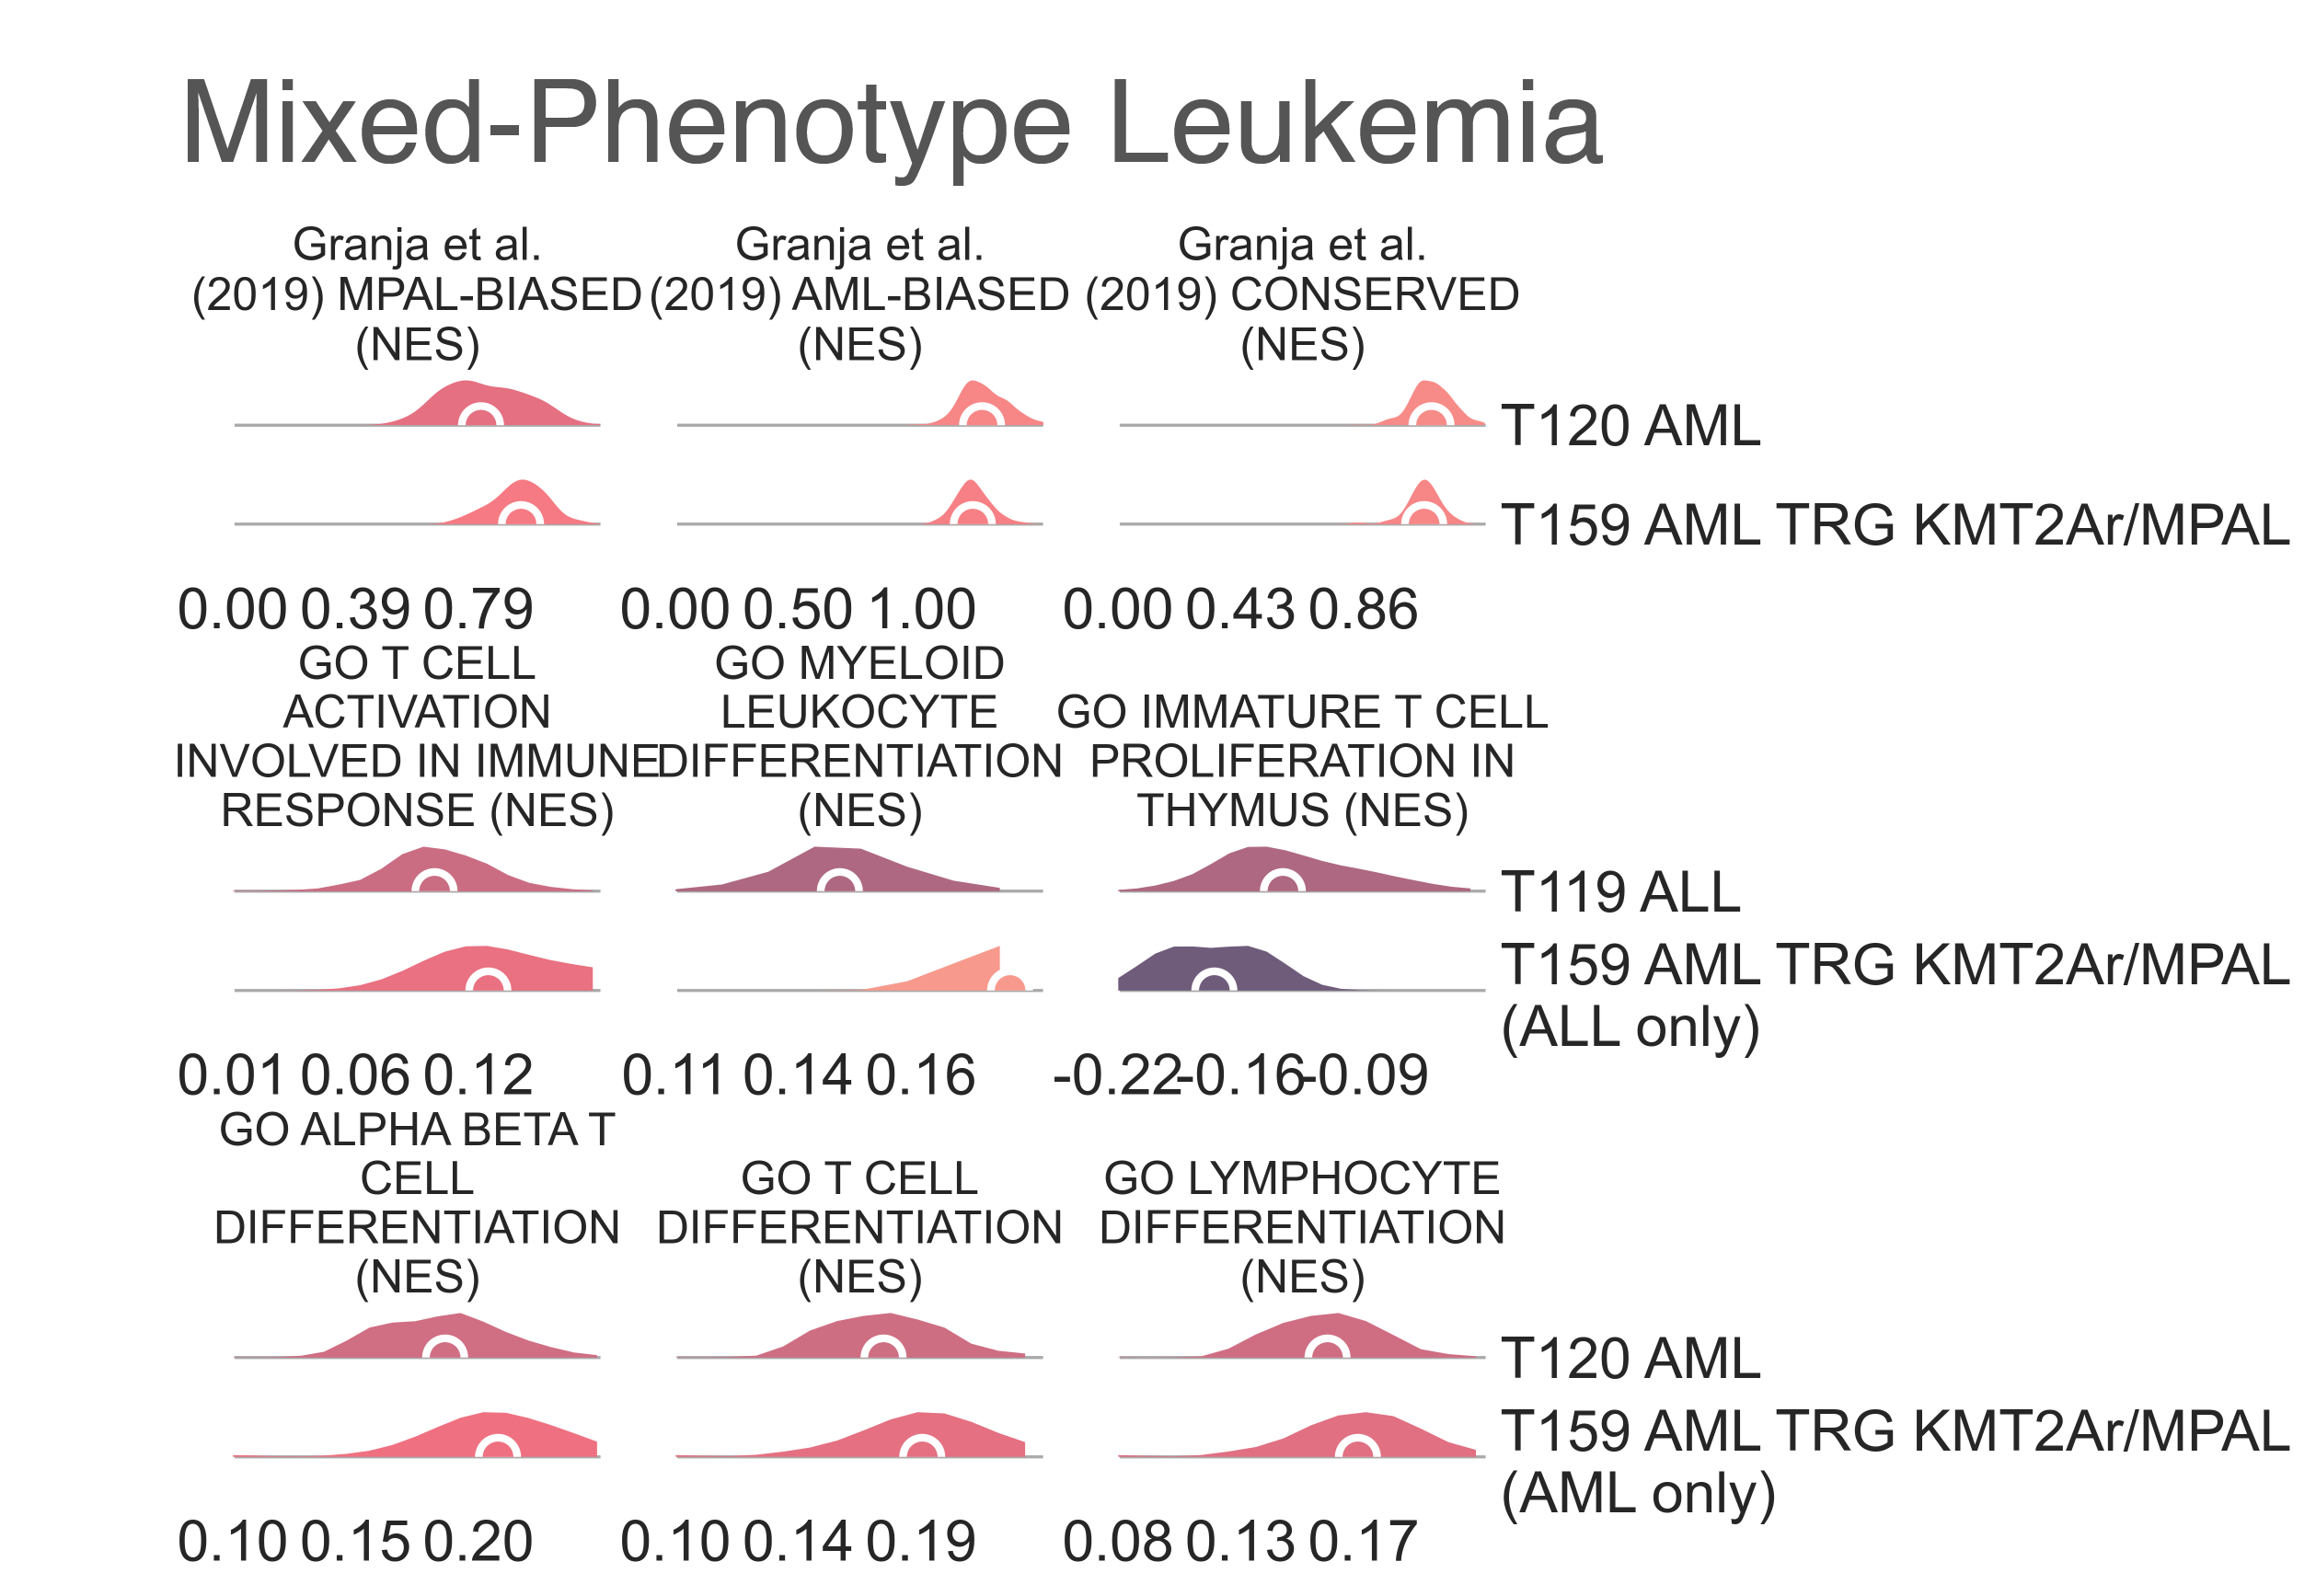
LEU9: Distribution plots of the normalized enrichment score of gene sets relevant to the definition of the KMT2A-rearranged myeloid leukemia classes from the TARGET cohort.
Finally, a more straightforward annotation allows us to determine T160 AML TRG CFB-MYH11 harbours core binding factor-mutated samples, as the majority of its samples are labelled as CFB-MYH11 fusion positive (n = 26/35, χ2 p-val = 9.70e-15), and furthermore shows enrichment (medNES ≥ 1.84, KW adj. p-val = 9.376e-16, Dunn adj. p-val < 1.00e-04) of its associated gene sets [Ross2004]. Similarly, T161 AML TRG RUNX-RUNX1T1 is largely composed of samples labelled as harbouring RUNX1-RUNX1T1 fusions (n = 18/29, χ2 p-val = 1.77e-11) and is enriched for respective gene sets (medNES ≥ 1.01, KW adj. p-val = 5.83e-04) [Tonks2007]. It also contains 6 CEBPA mutants (χ2 p-val = 8.21e-3).
Bibliography
- Ashburner2000(1,2,3,4,5)
Ashburner, M., Ball, C.A., Blake, J.A., et al. 2000. Gene Ontology: tool for the unification of biology. Nature Genetics 25(1), pp. 25–29.
- Bian2018
Bian, S., Hou, Y., Zhou, X., et al. 2018. Single-cell multiomics sequencing and analyses of human colorectal cancer. Science 362(6418), pp. 1060–1063.
- Braoudaki2010
Braoudaki, M., Papathanassiou, C., Katsibardi, K., Tourkadoni, N., Karamolegou, K. and Tzortzatou-Stathopoulou, F. 2010. The frequency of NPM1 mutations in childhood acute myeloid leukemia. Journal of hematology & oncology 3, p. 41.
- Dorrance2006
Dorrance, A.M., Liu, S., Yuan, W., et al. 2006. Mll partial tandem duplication induces aberrant Hox expression in vivo via specific epigenetic alterations. The Journal of Clinical Investigation 116(10), pp. 2707–2716.
- Harvey2010
Harvey, R.C., Mullighan, C.G., Wang, X., et al. 2010. Identification of novel cluster groups in pediatric high-risk B-precursor acute lymphoblastic leukemia with gene expression profiling: correlation with genome-wide DNA copy number alterations, clinical characteristics, and outcome. Blood 116(23), pp. 4874–4884.
- Harvey2013(1,2)
Harvey, R.C., Kang, H., Roberts, K.G., et al. 2013. Development and Validation Of a Highly Sensitive and Specific Gene Expression Classifier To Prospectively Screen and Identify B-Precursor Acute Lymphoblastic Leukemia (ALL) Patients With a Philadelphia Chromosome-Like (“Ph-like” or “BCR-ABL1-Like”) Signature For Therapeutic Targeting and Clinical Intervention. Blood 122(21), pp. 826–826.
- Hirabayashi2017
Hirabayashi, S., Ohki, K., Nakabayashi, K., et al. 2017. ZNF384-related fusion genes define a subgroup of childhood B-cell precursor acute lymphoblastic leukemia with a characteristic immunotype. Haematologica 102(1), pp. 118–129.
- Inukai2007(1,2)
Inukai, T., Hirose, K., Inaba, T., et al. 2007. Hypercalcemia in childhood acute lymphoblastic leukemia: frequent implication of parathyroid hormone-related peptide and E2A-HLF from translocation 17;19. Leukemia 21(2), pp. 288–296.
- Jain2017
Jain, N., Roberts, K.G., Jabbour, E., et al. 2017. Ph-like acute lymphoblastic leukemia: a high-risk subtype in adults. Blood 129(5), pp. 572–581.
- Lazar2013
Lazar, C., Meganck, S., Taminau, J., et al. 2013. Batch effect removal methods for microarray gene expression data integration: a survey. Briefings in Bioinformatics 14(4), pp. 469–490.
- Meyer2018
Meyer, C., Burmeister, T., Gröger, D., et al. 2018. The MLL recombinome of acute leukemias in 2017. Leukemia 32(2), pp. 273–284.
- Mullighan2007(1,2,3,4,5)
Mullighan, C.G., Kennedy, A., Zhou, X., et al. 2007. Pediatric acute myeloid leukemia with NPM1 mutations is characterized by a gene expression profile with dysregulated HOX gene expression distinct from MLL-rearranged leukemias. Leukemia 21(9), pp. 2000–2009.
- Ohki2019
Ohki, K., Kiyokawa, N., Saito, Y., et al. 2019. Clinical and molecular characteristics of MEF2D fusion-positive B-cell precursor acute lymphoblastic leukemia in childhood, including a novel translocation resulting in MEF2D-HNRNPH1 gene fusion. Haematologica 104(1), pp. 128–137.
- Qian2017
Qian, M., Zhang, H., Kham, S.K.-Y., et al. 2017. Whole-transcriptome sequencing identifies a distinct subtype of acute lymphoblastic leukemia with predominant genomic abnormalities of EP300 and CREBBP. Genome Research 27(2), pp. 185–195.
- Rachieru-Sourisseau2010
Rachieru-Sourisseau, P., Baranger, L., Dastugue, N., et al. 2010. DNA Index in childhood acute lymphoblastic leukaemia: a karyotypic method to validate the flow cytometric measurement. International Journal of Laboratory Hematology 32(3), pp. 288–298.
- deRooij2017(1,2)
de Rooij, J.D.E., Branstetter, C., Ma, J., et al. 2017. Pediatric non-Down syndrome acute megakaryoblastic leukemia is characterized by distinct genomic subsets with varying outcomes. Nature Genetics 49(3), pp. 451–456.
- Ross2004(1,2,3,4,5)
Ross, M.E., Mahfouz, R., Onciu, M., et al. 2004. Gene expression profiling of pediatric acute myelogenous leukemia. Blood 104(12), pp. 3679–3687.
- Sadras2017(1,2)
Sadras, T., Heatley, S.L., Kok, C.H., et al. 2017. Differential expression of MUC4, GPR110 and IL2RA defines two groups of CRLF2-rearranged acute lymphoblastic leukemia patients with distinct secondary lesions. Cancer Letters 408, pp. 92–101.
- Shaver2015
Shaver, A.C., Seegmiller, A.C., Strickland, S.A., et al. 2015. Mutational burden in acute myeloid leukemia is largely age dependent. Blood 126(23), pp. 2605–2605.
- Sugeedha2021
Sugeedha, J., Gautam, J. and Tyagi, S. 2021. SET1/MLL family of proteins: functions beyond histone methylation. Epigenetics 16(5), pp. 469–487.
- Sun2017
Sun, C., Chang, L. and Zhu, X. 2017. Pathogenesis of ETV6/RUNX1-positive childhood acute lymphoblastic leukemia and mechanisms underlying its relapse. Oncotarget 8(21), pp. 35445–35459.
- The2019(1,2,3,4)
The Gene Ontology Consortium 2019. The Gene Ontology Resource: 20 years and still GOing strong. Nucleic Acids Research 47(D1), pp. D330–D338.
- Tonks2007
Tonks, A., Pearn, L., Musson, M., et al. 2007. Transcriptional dysregulation mediated by RUNX1-RUNX1T1 in normal human progenitor cells and in acute myeloid leukaemia. Leukemia 21(12), pp. 2495–2505.
- Valk2004(1,2,3)
Valk, P.J.M., Verhaak, R.G.W., Beijen, M.A., et al. 2004. Prognostically useful gene-expression profiles in acute myeloid leukemia. The New England Journal of Medicine 350(16), pp. 1617–1628.
- Verhaak2009
Verhaak, R.G.W., Wouters, B.J., Erpelinck, C.A.J., et al. 2009. Prediction of molecular subtypes in acute myeloid leukemia based on gene expression profiling. Haematologica 94(1), pp. 131–134.
- Winters2017
Winters, A.C. and Bernt, K.M. 2017. MLL-Rearranged Leukemias-An Update on Science and Clinical Approaches. Frontiers in pediatrics 5, p. 4.
- Yagi2003
Yagi, T., Morimoto, A., Eguchi, M., et al. 2003. Identification of a gene expression signature associated with pediatric AML prognosis. Blood 102(5), pp. 1849–1856.
- Yang2017
Yang, W., Tran, P., Khan, Z., Rezk, S. and O’Brien, S. 2017. MLL-rearranged mixed phenotype acute leukemia masquerading as B-cell ALL. Leukemia & Lymphoma 58(6), pp. 1498–1501.
- Yeoh2002
Yeoh, E.-J., Ross, M.E., Shurtleff, S.A., et al. 2002. Classification, subtype discovery, and prediction of outcome in pediatric acute lymphoblastic leukemia by gene expression profiling. Cancer Cell 1(2), pp. 133–143.