T002 and T003 Mesodermal Tumour
Version: 0.1.0
Last change: May 07, 2022
We find that most sarcomas and other mesenchymal cancers, together with sarcomatoid solid tumors, are divided into two major families. Samples in T002 MESODM STEMlow (n = 565) have lower stemness and higher immune infiltration, while T003 MESODM STEMhigh (n = 483) have higher stemness and lower immune infiltration (Fig. MESD1a, c)
MESD1: A, 2-dimensional UMAP projection of Mesodermal tumors by gene expression. Subtypes at the second level of the hierarchy are shown with different shades of green if they belong to the parent class T002 MESODM STEMlow), of orange if they stem from T003 MESODM STEMhigh. B, the list of all Mesodermal subtypes identified and their hierarchical relationship. C) 2-dimensional UMAP projection of the same group of tumors, with samples coloured according to our in-house stemness score (left), immune score (center) or age (right).
MESD1B: Distributions of stemness (upper) and immune activity (lower) scores across the mesodermal tumour subtypes in T002 MESODM STEMlow (left) and T003 MESODM STEMHigh (right).
T002 Mesodermal tumor with low stemness
T002 splits into two clusters at the first level: T067 LMS (n = 78), which contains most leiomyosarcomas (LMS) and T066 MESODM STEMlow A (n = 487), carrying the remaining malignancies (Fig. MESD1b).
Leiomyosarcoma
T067 LMS shows, as expected, overexpression of genes relating to smooth muscle development, including ACTA2 (logFC = -4.29, FDR = 6.853e-133), ACTG2 (logFC = -7.92, FDR = 2.126e-168), DES (logFC = -7.62, FDR = 4.876e-121), and MYOC (logFC = -8.66, FDR = 5.518e-154), with patients in this group exhibiting significantly better survival than samples in T066 MESODM STEMlow A (lrt p-val = 2.92e-03 at 5840 days). It is then divided in three subclasses roughly defined by tumor location. T087 ULMS (n = 18) is composed of uterine LMS (n = 14, χ2 p-val = 8.96e-11), T088 STLMS ABD (n = 23) is largely composed of abdominal or retroperitoneal soft tissue LMS (n= 16, χ2 p-val = 7.85e-05), while T089 STLMS EXT (n = 29) contains a significant portion of LMS of the extremities (n = 9, χ2 p-val = 3.56e-04). Though there is no significant difference in overall survival between the groups (lrt p-val = 1.32e-01 at 3765 days), T089 STLMS EXT has a higher incidence of relapsed tumors (χ2 p-val = 2.93e-02).
Mesodermal tumor with low stemness not including Leiomyosarcoma
T066 MESODM STEMlow A splits into three groups:
osteosarcomas in T068 OSARC (n = 131), a class of sarcoma containing mixed diagnoses in
T069 SARC STEMlow (n = 275), and mesotheliomas in
T070 MPM (n = 81) (Fig. MESD1a, b).
These clusters differ significantly in age (KW adj. p-val = 1.67e-33)
in their proportion of pediatric patients (χ2 p-val ≤ 4.49e-56);
T068 OSARC has the youngest patients (median age of 15 y.o.)
and is almost exclusively pediatric (96.18% of samples).
At variance, mesotheliomas in T070 MPM are almost exclusively adult tumors,
with patients’ median age being 63 y.o., and significantly worse overall survival than the other two classes
(lrt p-val = 3.90e-11 at 5840 days).
Finally, T069 SARC STEMlow, the mixed sarcoma class, is in between, with patients’ median age being 60
y.o. and 23.63% pediatric patients.
Of note, within T069 SARC STEMlow we observe the surprising presence of a number of samples from diseases,
such as osteosarcoma (n = 26) and LMS (n = 12), for which a type-specific cluster is available
(See T068 OSARC and T067 LMS)
Samples from said diseases present in T069 SARC STEMlow
reflect clinically and/or developmentally distinct groups within these specific tumor types that may exhibit
different levels of immune activity, genomic lesions, tumor differentiation, and disease progression compared
to their bona fide clusters, as recently described [Anderson2021].
Osteosarcoma
The tumors in T068 OSARC divide into four distinct subtypes (Fig. MESD2a). All samples for which we have clinical data are central osteosarcomas of the long bones or pelvis (TARGET discovery cohort).
MESD2: A, 2-dimensional UMAP projection of osteosarcoma tumors by gene expression. The four subtypes are shown with different colours. B, Overall survival time curves for the four osteosarcoma subtypes. C, distribution plots of in-house cartilage development (left), bone develompent (center) scores, and SP7 expression (right).
T071 OSARC OSSIF (n = 32)
contains predominantly male patients (75.00% of samples) with a median age of 15.65 y.o..
It exhibits overexpression (FDR < 0.05)
of cancer testis antigen (CTA) genes, most notably the SSX (8/9 genes), MAGEA (10/12), MAGEB (6/10), CSAG (2/2) and XAGE (4/5)
families, several of which are known to be upregulated in osteosarcoma [Zou2012].
Though CTA expression has been associated with poor prognosis in osteosarcoma [Zou2012],
this cluster exhibits favourable prognosis when compared to its sibling clusters (lrt p-val = 5.56e-05 at 5840 days,
median OS not reached) (Fig. MESD2b).
As this cluster is also associated with direct ossification (medNES ≥ 1.01,
KW adj. p-val = 6.69e-10)
and positive regulation of osteoblast differentiation (medNES ≥ 1.05,
KW adj. p-val = 4.18e-02)
and highly expresses ALPL (median logFC = 0.998, FDR ≤ 9.069e-03 vs.
T072 OSARC CHOND and T074 OSARC OSCL)
it may represent a subtype of osteoblastic or non-specific Osteosarcoma, good prognosis.
T072 OSARC CHOND (n = 38) also contains predominantly male patients (57.89%),
with a median age of 15 y.o.. It is enriched for chondrocyte marker genes, such as COL9A1
(median logFC = 7.73, FDR ≤ 7.08e-08), SOX9
(median logFC = 2.20, FDR ≤ 3.34e-05), and
OGN (median logFC = 3.98, FDR ≤ 1.16e-03),
as well as genesets for collagen synthesis (medNES ≥ 1.97,
KW adj. p-val = 1.20e-12,
Dunn adj. p-val < 1.00e-03),
chondrocyte differentiation (medNES ≥ 1.13,
KW adj. p-val = 1.77e-09,
Dunn adj. p-val < 1.00e-03),
and cartilage development involved in endochondral morphogenesis (medNES = 1.13,
KW adj. p-val = 4.21e-09)
[Ashburner2000], [TGOC2019] (Fig. MESD3).
These data suggest these tumors have significant chondroid components and may represent chondroblastic osteosarcoma.
Furthermore, T072 OSARC CHOND
contains all osteosarcomas of the pelvis, including the ilium and sacrum, in our dataset
(0/22 vs. 4/16 vs. 0/17 vs. 0/3, χ2 p-val = 1.03e-02), a location
associated with chondroblastic osteosarcomas [Saab2005], [Kawai1998].
T072 OSARC CHOND also overexpresses
MYC (median logFC = 1.2, FDR ≤ 4.67e-04),
and has the lowest expression of RB1 (median logFC = -1.11,
FDR ≤ 1.63e-03). Patients in this cluster exhibit poor overall survival,
reaching median OS at 1906 days post diagnosis (Fig. MESD2b).
T073 OSARC OSBLA (n = 37) has the youngest
group of patients with a median age of 13.66 y.o. and is composed predominantly
of female patients (57.89% of the samples).
It significantly overexpresses the master bone regulator SP7 (median logFC = 0.939,
FDR ≤ 1.712e-02) (Fig. MESD2c),
and osteoblast markers SOST (median logFC = 5.66,
FDR ≤ 1.437e-04)
and SATB2 (median logFC = 1.52, FDR ≤ 1.142e-03) [Conner2013].
Furthermore, it is enriched for genesets for bone mineralization (medNES ≥ 1.02,
KW adj. p-val = 4.26e-05),
and replacement ossification of existing non-cartilagenous tissues (medNES ≥ 1.07,
KW adj. p-val = 2.23e-03,
Dunn adj. p-val < 5.00e-02)
[Ashburner2000], [TGOC2019] (Fig. MESD3).
It also displays enrichment of mTORC1 signalling (medNES ≥ 1.03,
KW adj. p-val = 1.41e-06,
Dunn adj. p-val < 1.00e-02),
associated with poor prognosis in osteosarcoma [Hu2016], as well as cell cycle progression
(medNES ≥ 1.01,
KW adj. p-val = 5.76e-05,
Dunn adj. p-val < 5.00e-02).
Samples within this cluster exhibit the worst overall survival of all osteosarcoma clusters,
reaching median OS at 679 days post diagnosis (Fig. MESD2b).
As this cluster is composed of ossifying tumors with very poor prognosis, it may represent an aggressive
subtype of osteoblastic osteosarcoma.
Finally, T074 OSARC OSCL (n = 11)
is the smallest cluster, with the oldest median age (22.57 y.o.),
and predominantly female composition (75.00% of the samples).
It also exhibits the best overall survival among all its siblings, with no deaths recorded in our dataset at 5840 days
(Fig. MESD2b).
Gene sets analysis revealed significant enrichment of sets related to osteoclast differentiation
(medNES = 6.80e-11,
Dunn adj. p-val < 1.00e-02),
bone remodelling (medNES ≥ 1.14,
KW adj. p-val = 3.14e-06,
Dunn adj. p-val < 5.00e-02),
and fibrinolysis (medNES ≥ 9.43,
KW adj. p-val = 8.83e-06,
Dunn adj. p-val < 1.00e-04)
[Ashburner2000], [TGOC2019] (Fig. MESD3).
This profile suggests this cluster contains osteoclast-rich and highly lytic or unstable tumors,
likely representing telangiectatic osteosarcoma, though we lack the clinical annotation
to confirm histotypes for any of the osteosarcoma samples present.
MESD3: Distribution plots of the expression of genes (top) and gene sets (bottom) relevant to the definition of the four identified osteosarcoma transcriptional subtypes.
Mesothelioma
Similarly, the chidren of T070 MPM follow a simple path in their subtyping hierarchy (Fig. MESD1b). It first splits into two clusters: T083 MPM BP1 LOH (n = 59), a mixed biphasic and epithelial class, and T084 MPM EPITH (n = 23) which is composed almost exclusively of epithelial tumors (17/21). T083 MPM BP1 LOH shows higher BP1 loss of heterozygosity (p-val = 3.96e-2) [Pulford2017], [Alakus2015] has significantly worse prognosis than T084 MPM EPITH (lrt p-val = 1.20e-3 at 2800 days post diagnosis), and shows higher EMT (epithelial mesenchymal transition) scores (MWU adj. p-val = 4.24e-05) [Hmeljak2018] due to its biphasic component, as well as lower ploidy (MWU adj. p-val = 1.55e-3). T083 MPM BP1 LOH further splits by histology, with T085 MPM BP1 LOH (n = 23) containing both biphasic and epithelial samples and T086 MPM BP1 LOH EPITH (n = 23) being almost exclusively composed of epithelial tumors. As before, T086 MPM BP1 LOH EPITH, with a majority component of biphasic samples exhibit a significantly higher EMT score (MWU adj. p-val = 1.73e-2).
Mixed low-stemness sarcoma
The hierarchy of T069 SARC STEMlow is deeper and more complex than the bona fide sarcoma groups (Fig. MESD1b, MESD4). At the first level, we see the separation of T075 SARC STEMlow A (n = 218) and T076 SARC CIN (n = 57).
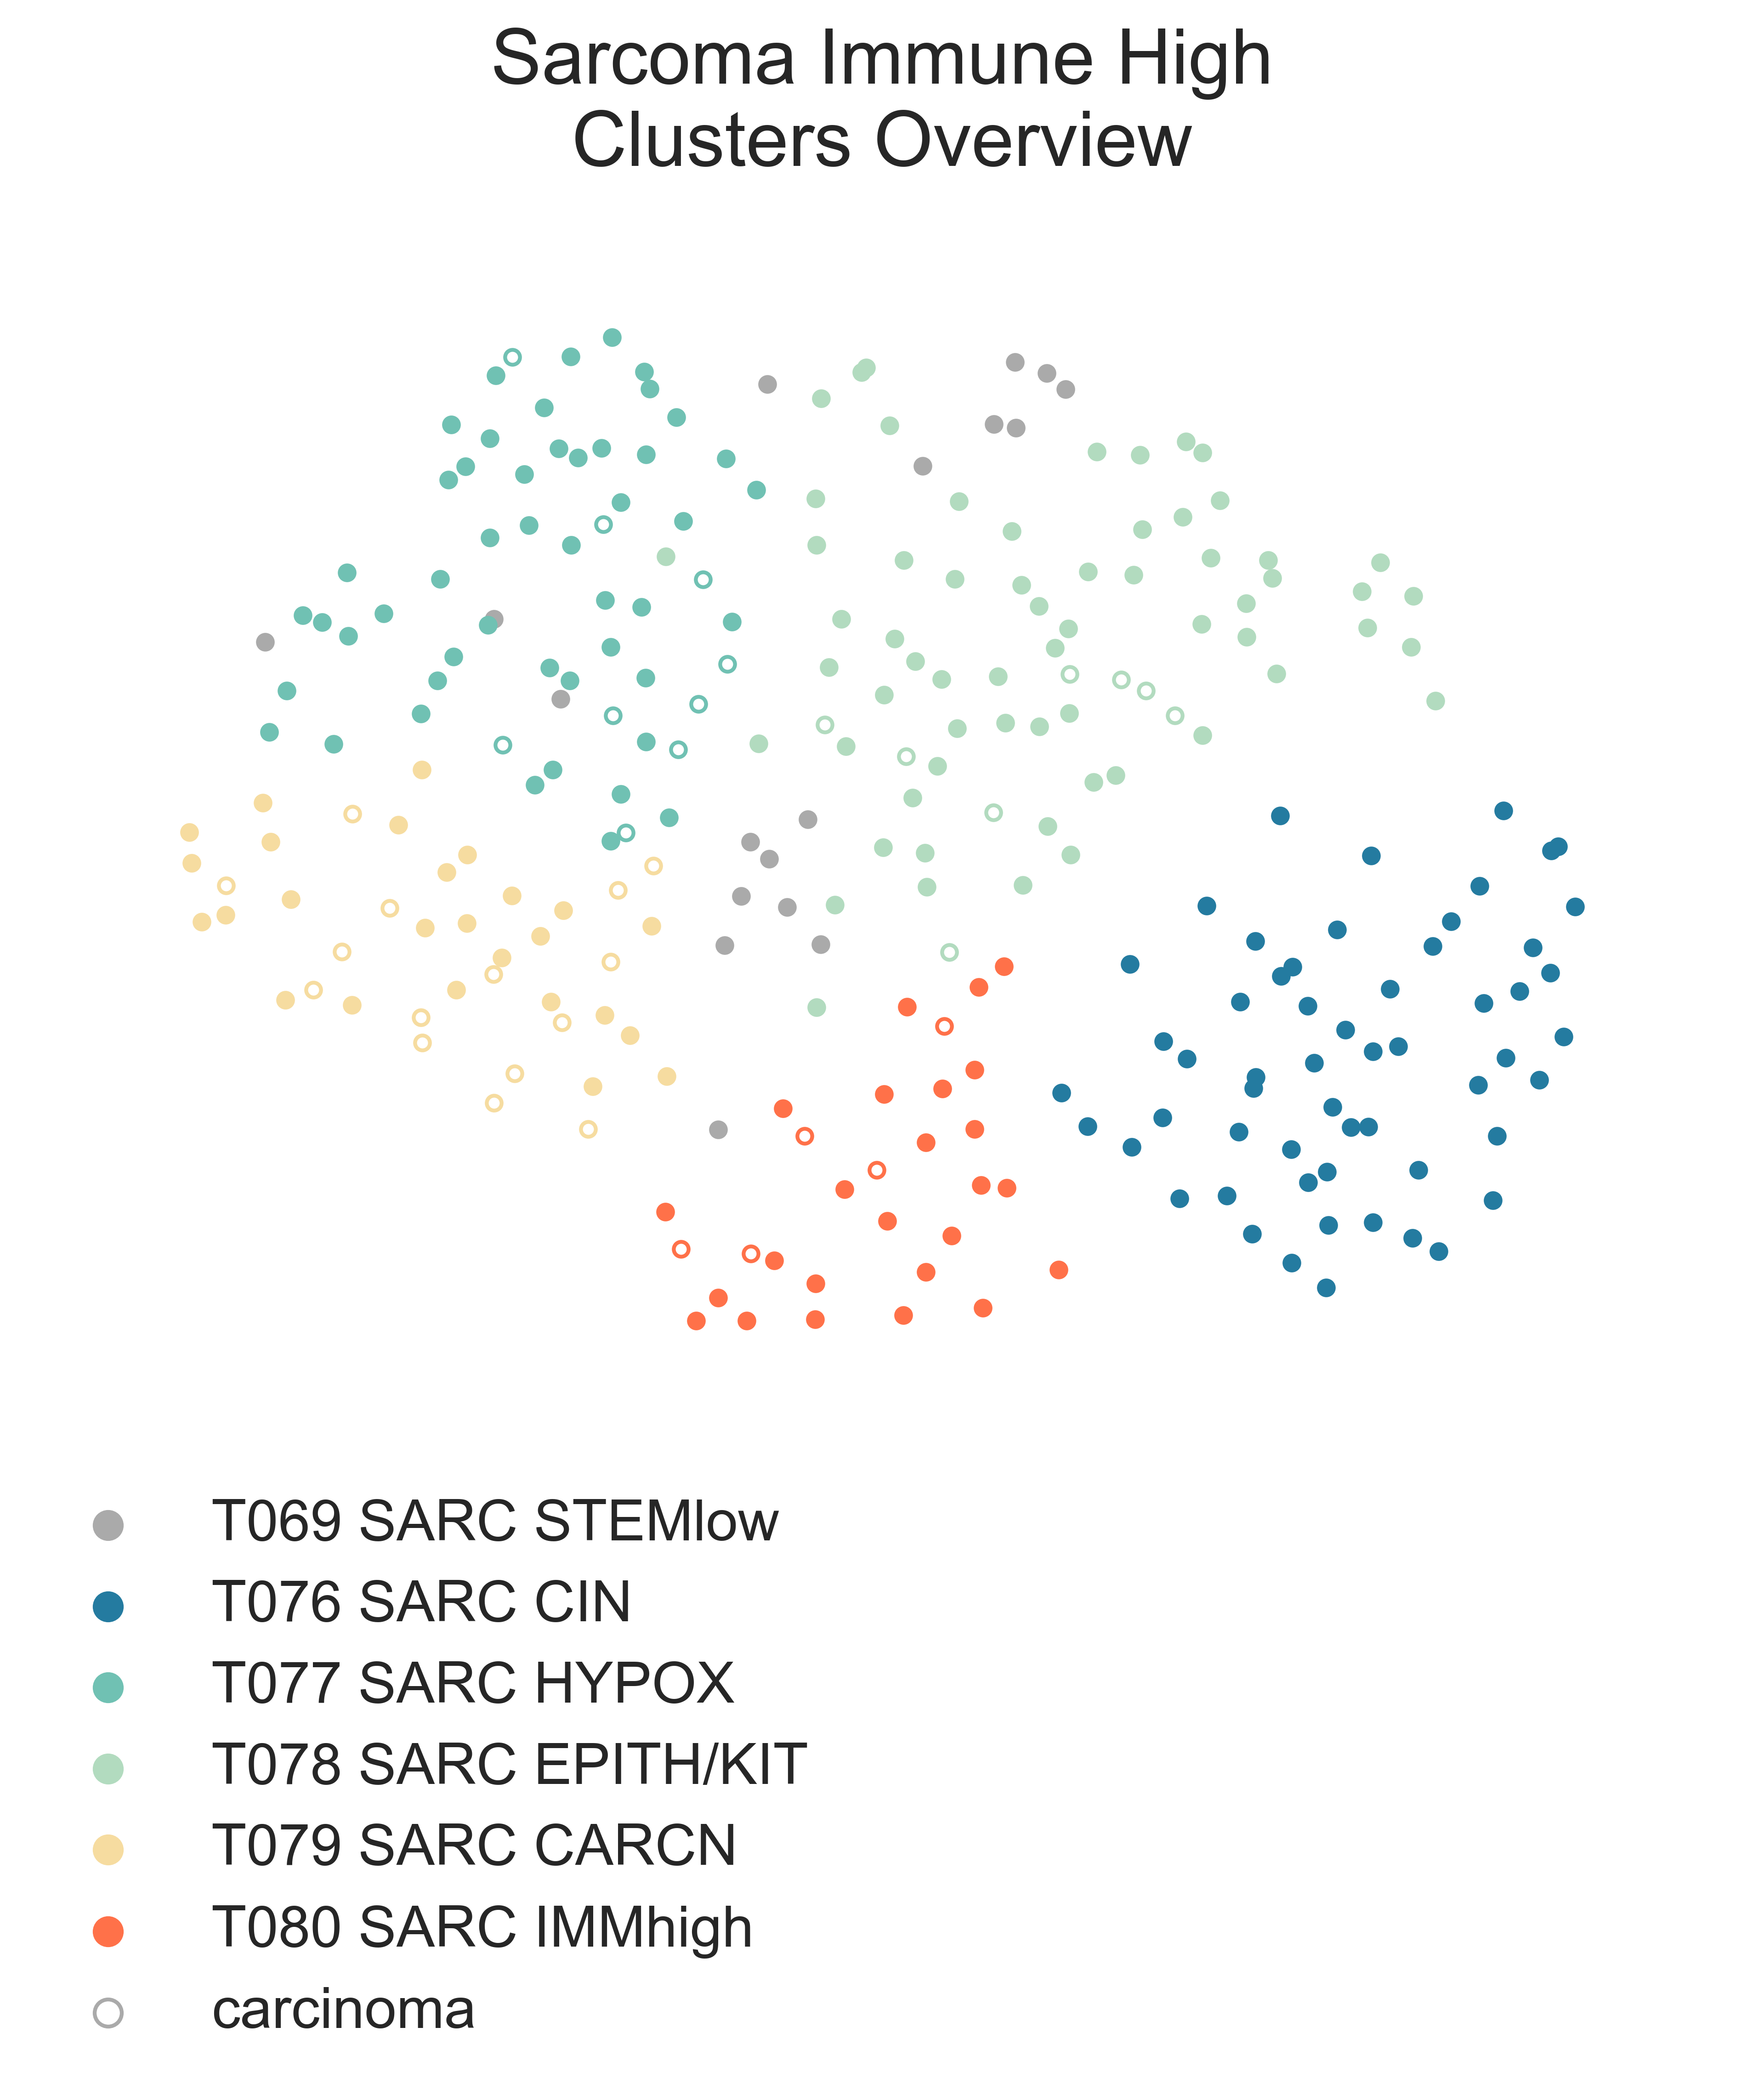
MESD4: 2-dimensional UMAP projection of mixed sarcoma tumors with low stemness by gene expression. The subtypes identified are shown with different colours. Samples labelled as carcinoma by their presenting institution are shown as empty circles.
Both are mixed clusters, though T076 SARC CIN contains mostly soft tissue sarcoma, including dedifferentiated liposarcoma (DDLPS), undifferentiated pleomorphic sarcoma (UPS), and myxofibrosarcoma (MFS). T075 SARC STEMlow A contains significantly younger patients, likely due to the presence of a high number of osteosarcoma, (58.00 vs. 65.00, MWU adj. p-val = 9.16e-04) but we observed no difference in survival between the two classes (lrt p-val = 5.10e-01 at 5204 days). T075 SARC STEMlow A overexpresses (FDR < 0.05 & median logFC > 0) CTA genes, which show considerable promise for immunotherapeutics [Gjerstorff2015]. These include GAGE (9/13), PAGE (4/6), MAGEA (11/12), MAGEC (3/3), and XAGE (3/5) [Carregaro2013]. We then investigated immune checkpoint ligands and receptors expression, revealing overexpression of PD1 (median logFC = -3.37, FDR ≤ 2.044e-03), PDL1 (median logFC = -0.87, FDR ≤ 1.078e-02), and CTLA4 in T075 SARC STEMlow A (median logFC = -2.75, FDR ≤ 8.047e-06). Consistent with this, T075 SARC STEMlow A displays the lowest leukocyte fraction of its siblings (KW adj. p-val = 5.11e-10, Dunn adj. p-val ≤ 3.69e-04) [Thorsson2018]. More interestingly, samples in T076 SARC CIN show significantly higher chromosomal instability (CIN) (MWU adj. p-val = 1.15e-05) (MESD5) without a corresponding difference in mutation load (MWU adj. p-val = 4.75e-01); this holds true for both DDLPS (MWU adj. p-val = 3.70e-03) and UPS (MWU adj. p-val = 1.43e-02) subpopulations when taken independently [TCGA2017] .
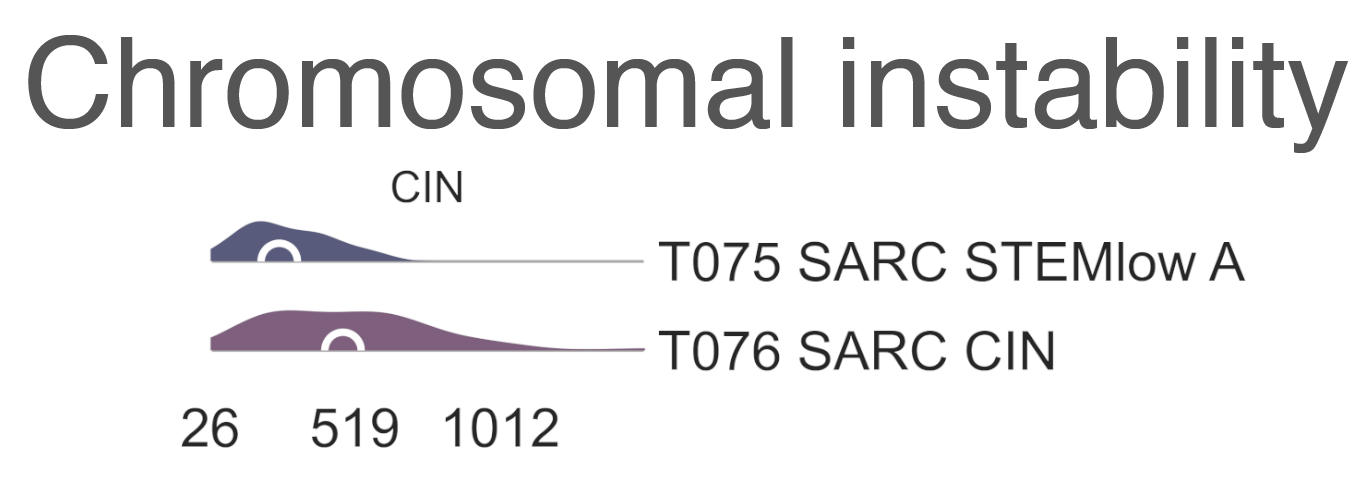
MESD5: Distribution plots of chromosomal instability in sarcomas.
T076 SARC CIN then splits by diagnosis into
T081 UPS/MFS CIN (n = 33),
containing mostly UPS and MFS,
and T082 DDLPS CIN (n = 24) (Fig. S23b),
which is largely composed of DDLPS.
This is reflected in the higher amplification of chr12q15, common to DDLPS,
in T095 MYOGEN FUS- A
(median amp. 23.00 vs 2.00, MWU adj. p-val = 8.335e-07) [TCGA2017] .
Furthermore, T082 DDLPS CIN has both significantly higher genomic
amplification and gene expression of MDM2 (2.40e-2 vs. 3.66, MWU adj. p-val = 4.37e-06;
logFC = -4.55, FDR = 5.39e-18)
and CDK4 (0.00 vs. 3.66 MWU adj. p-val = 7.48e-06;
logFC = -4.27, FDR = 5.39e-18) [TCGA2017] .
Finally, T075 SARC STEMlow A separates into four terminal
classes, with varying disease composition, immunogenicity, and patient age (MESD6).
Nevertheless, there are no significant differences in survival between these clusters.
T077 SARC HYPOX (n = 58) contains a high variability of diagnoses but is mostly composed of osteosarcoma,
UPS, and LMS. Only 31.03% of these samples are pediatric,
the median age is 60 y.o. Sarcoma,in this cluster display the highest mitotic rate compared to those in sibling clusters
( = 4.75e-05),
as also reflected in gene set enrichment analysis (logFC = 0.871, adj. p-val = 7.76e-01).
This cluster also has the lowest expression of TP53 (logFC ≤ 1.78e-11).
Tumours in T077 SARC HYPOX display the lowest leukocyte fraction
(KW adj. p-val = 5.11e-10,
Dunn adj. p-val ≤ 1.70e-07)
among this family, and also exhibit the lowest expression of the immune checkpoint genes PD1 (median logFC = -3.37,
FDR ≤ 2.044e-03), PDL1 (median logFC = -0.87, FDR ≤ 1.078e-02), and CTLA4 (median logFC = -2.75, FDR ≤ 8.047e-06).
It is enriched for genes associated with hypoxia in soft tissue sarcomas (medNES ≥ 1.08,
KW adj. p-val ≤ 1.44e-05,
Dunn adj. p-val < 0.05) [Yang2018] (Fig. MESD6).
T078 SARC EPITH/KIT (n = 77) is the largest cluster,
and is mostly composed of osteosarcoma and DDLPS, but importantly also contains five gastrointestinal
stromal tumors (GIST). It is the cluster with the youngest median age (24 y.o.
= 2.50e-06,
57.14% pediatric, χ2 p-val = 4.66e-11).
T078 SARC EPITH/KIT has the highest expression of the
KIT proto-oncogene (median logFC = 1.33, FDR ≤ 3.88e-02) (Fig. MESD6).
Mutations in KIT are a major driver of GIST [Hirota1998] and may explain their affinity to this class.
Nevertheless, KIT mutations are not exclusive of this tumor type [Smithey2002], and, indeed, the significance in overexpression is maintained
after the removal of GISTs
(median logFC = 1.52, FDR ≤ 4.11e-02).
We confirmed enrichment of KIT downstream genes with gene sets analysis
(medNES ≥ 1.02, KW adj. p-val = 7.82e-08)
[Schaefer2009] (Fig. MESD6).
T078 SARC EPITH/KIT also displays the highest
chr12q13-15 amplification among its siblings ( = 6.77e-04),
likely a consequence of its high population of DDLPS .
Furthermore, T078 SARC EPITH/KIT
has the highest expression of epithelial markers EPCAM (median logFC = 1.41, FDR ≤ 1.280e-02),
CLDN1 (median logFC = 1.86, FDR ≤ 2.941e-04),
and CDH1 (median logFC = 2.02, FDR ≤ 7.437e-03)
among its siblings and shows enrichment of epithelial development gene sets (medNES ≥ 1.12,
KW adj. p-val = 4.43e-16,
Dunn adj. p-val < 1.00e-04)
[Ashburner2000], [TGOC2019] (Fig. MESD6).
It is also enriched for gene sets involving angiogenesis (medNES ≥ 1.10,
KW adj. p-val = 3.12e-08,
Dunn adj. p-val < 0.05) [Liberzon2015],
which has been implicated in the pathogenesis of sarcoma with epithelial features [Quesada2012].
As such, we hypothesize that this class comprises Sarcoma, epithelial differentiation and related tumors,
possibly including epitheloid subtypes of DDLPS , osteosarcoma, and others [Deyrup2007], [Thway2016], [Makise2017].
The majority of samples present in T079 SARC CARCN (n = 41)
are not labelled by their source institutions as malignancies of mesenchymal origin, but rather as carcinomas or related
ecto- or endodermal tumors (Fig. MESD4). In fact, 23/41 tumors are carcinomas or skin cutaneous melanoma compared to 15/41 being sarcomas;
however, sarcomatoid components were noted in many of these samples’ clinical data when available [TCGA2017].
T079 SARC CARCN is enriched for
E2F targets (medNES = 1.06,
KW adj. p-val = 6.17e-28) ,
MYC targets (medNES ≥ 1.02,
KW adj. p-val ≤ 3.59e-25,
Dunn adj. p-val < 1.00e-03),
and DNA synthesis (medNES ≥ 1.04,
KW adj. p-val = 5.04e-24,
Dunn adj. p-val < 5.00e-02)
and G2M checkpoint (medNES ≥ 1.04,
KW adj. p-val = 1.16e-28) pathways
[Ashburner2000], [TGOC2019], suggesting its constituents share a pool of mutations whose pathways converge upon increased translation,
protein processing, and cell cycle progression.
It is also highly enriched for gene sets involving translation (medNES ≤ 1.02,
KW adj. p-val = 1.07e-19,
Dunn adj. p-val < 5.00e-02) and protein processing
(medNES ≤ 1.10,
KW adj. p-val = 2.31e-18, Dunn adj. p-val < 1.00e-04) ([Ashburner2000]; [TGOC2019]). Intereatingly, Sarcoma,in this class have a significantly higher mutation load than those in sibling clusters (median 96.00, KW adj. p-val = 1.60e-03) [TCGA2017].
This cluster also has a high leukocyte fraction, with the highest lymphocyte content of its siblings
(KW adj. p-val = 3.325e-4),
specifically CD8+ T cells (KW adj. p-val = 3.14e-06) [Newman2015].
T080 SARC DIFFlow IMMhigh (n = 30) is the smallest child cluster of
T075 SARC STEMlow A and contains the oldest patient cohort
(median age of 62 y.o., KW adj. p-val = 2.50e-06)
with no pediatric samples. It is mainly composed of DDLPS (dedifferentiated liposarcoma) and UPS,
similar to T082 DDLPS CIN, but significantly lower in chromosomal instability.
It is possible a similar subdivision by diagnosis would have been observed with a more sizeable cohort. It has the highest leukocyte
fraction of its sibling classes (KW adj. p-val = 5.11e-10)
and is significantly enriched (medNES ≥ 1.06,
KW adj. p-val ≤ 8.90e-11)
for a myriad of gene sets relating to the immune response, proinflammatory signalling, and complement activation [Liberzon2015].
We hypothesize that T080 SARC DIFFlow IMMhigh represents a group of soft tissue sarcoma with high immune infiltration.
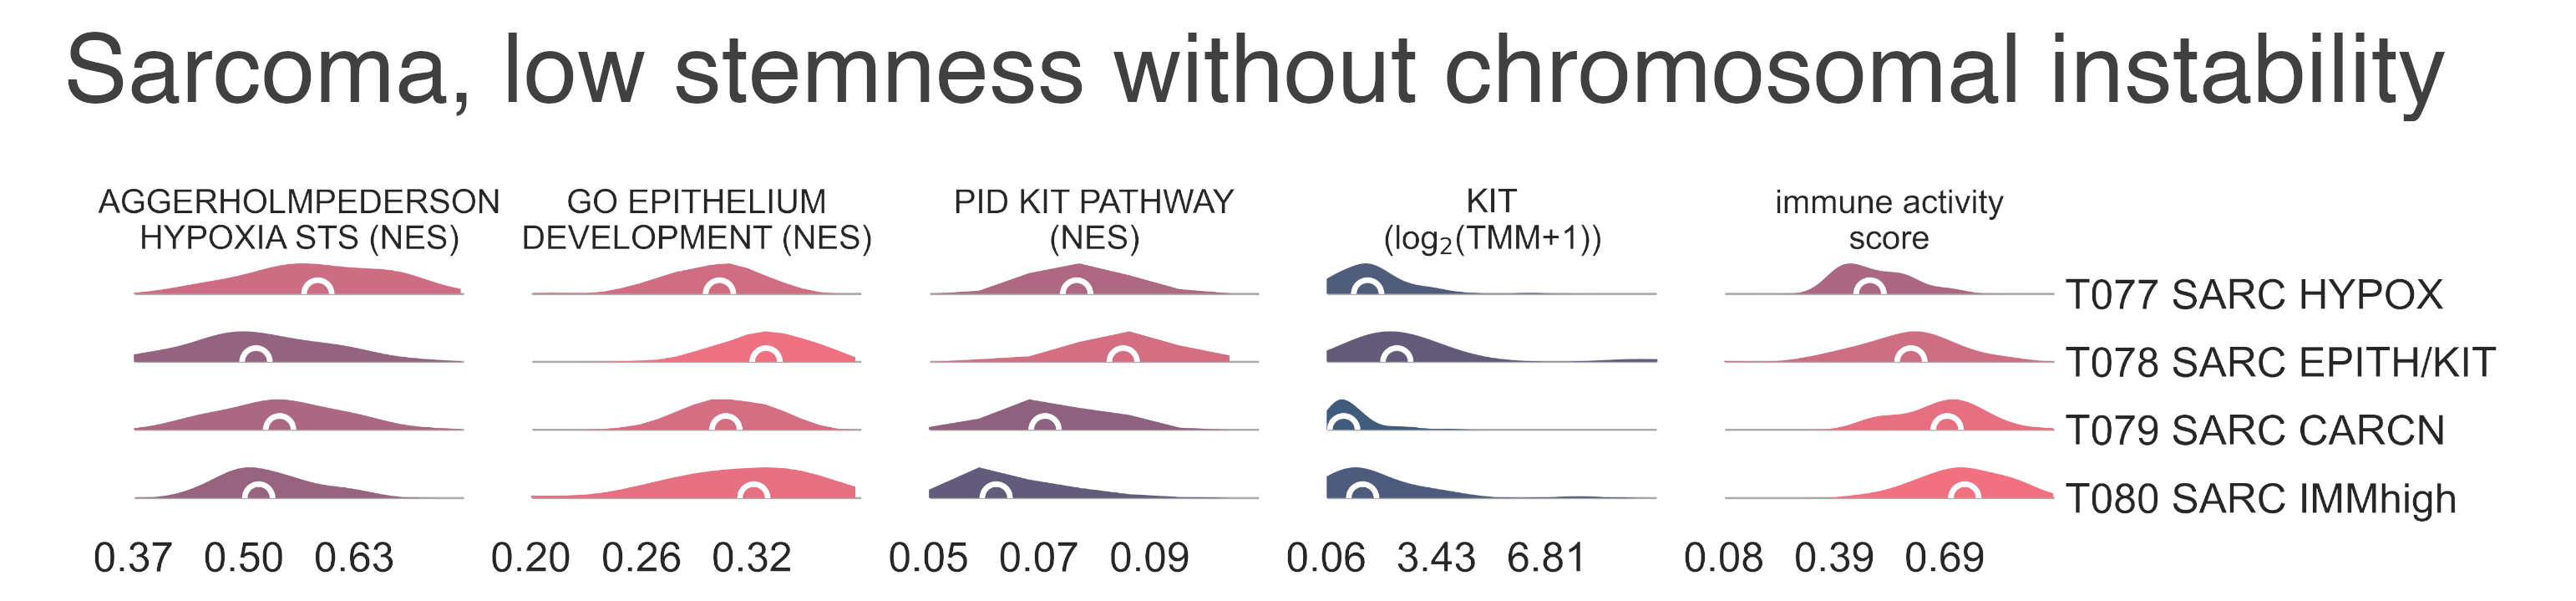
MESD6: Distribution plots of the expression of genes and gene sets relevant to the definition of low-stemness sarcomas transcriptional subtypes without chromosomal instability.
T003 Mesodermal tumor with high stemness
Following the hierarchy along the high stemness sarcomas branch, T003 MESODM STEMhigh, we first observe a separation by diagnosis (Fig. MESD1a). T090 MYOGEN is composed of myogenic sarcoma, and the median pateint age is 7.00 y.o., T091 MESODM STEMhigh A (n = 212) is the largest and most diverse cluster; it is composed of Testicular Germ Cell Tumours (TGCT) synovial sarcomas (SYSARC), and uterine carcinosarcomas (UCS), among other tumor types. It is the cluster with the oldest patients, with a median age of 33.00 y.o.. Finally, we observe a homogeneous Wilms tumors class, T092 WILMS (n = 119), which contains patients with youngest median age (4.38 y.o.).
Myogenic tumor
Myogenic tumors in T090 MYOGEN further split into
T093 MYOGEN FUS- (n = 108) containing the majority of embryonal rhabdomyosarcomas
(ERMS) and other myogenic malignancies, and T094 RMSARC ALV FUS+
(n = 47), which contains the majority of alveolar rhabdomyosarcomas (ARMS) (Fig. MESD1b).
Indeed, T093 MYOGEN FUS- exhibits significantly higher expression of the
FOXO1-PAX3/7 fusion-negative markers HMGA2 (logFC = 4.76, FDR = 3.82e-17),
EGFR (logFC = 2.73, FDR = 2.72e-19), and FBN2
(logFC = 5.35, FDR = 9.920e-35), while
T094 RMSARC ALV FUS+ shows marked overexpression
(logFC ≤ -3.17, FDR ≤ 9.73e-22) of FOX1-PAX3/7 fusion-positive markers
TFAP2B (logFC = -9.14, FDR = 5.078e-45) and
CDH3 (logFC = -3.17, FDR = 9.728e-22) [Davicioni2009], [Parham2013],
and significant enrichment (medNES ≥ 1.12,
MWU adj. p-val (Mann Whitney U test Benjamin-Hochberg adjusted p-value ≤ 3.79e-18) of
FOXO1-PAX3/7 fusion-associated pathways [Gryder2017], [Davicioni2009] (Fig. MESD7).
Though T093 MYOGEN FUS- contains a handful of samples labelled as
ARMS, it is sensible to speculate these may be fusion-negative;
this occurrence is common and the fusion is not a necessary feature of this histotype [Barr2002].
In fact, the molecular profile and clinical course of fusion negative ARMS is indistinguishable from
ERMS, supporting a common transcriptional identity as observed here [Williamson2010].
However, though ARMS is associated with worse prognosis than
ERMS, due to a lack of clinical annotatioon we are unable to confirm any
differences in survival between T093 MYOGEN FUS- and
T094 RMSARC ALV FUS+.
T093 MYOGEN FUS- then divides into two clusters.
We observe the separation of a small group of samples labelled as Wilms tumors,
T096 WILMS MYO (n = 12) from the rest of fusion-negative myogenic tumors in
T095 MYOGEN FUS- A (n = 95) (Fig. MESD7).
When compared to T092 WILMS (see below for details), the major Wilms tumor class,
T096 WILMS MYO has high expression of striated muscle genes such as
MYL1 (logFC = 11.9, FDR = 4.61e-51), MYOG (logFC = 9.45,
FDR = 3.93e-55), and MYOD1 (logFC = 8.93, FDR = 1.12e-51).
Furthermore, T096 WILMS MYO is enriched for gene sets related to skeletal muscle development
(MWU adj. p-val (Mann Whitney U test Benjamin-Hochberg adjusted p-value = 3.56e-09, medNES = 1.85)
[Ashburner2000], [TGOC2019] (Fig. MESD7),
suggesting this specific subtype of Wilms tumors to have significant areas with skeletal muscle differentiation.
As an alternative hypothesis, we also advance the possibility this may be a class of misdiagnosed rhabdomyosarcoma of the kidney
, [Mehrain2013], [Samkari2018] or a striated-muscle-like Wilms tumor phenotype.
Furthermore, T096 WILMS MYO is enriched for gene sets of rhabdomyosarcomas both with and without
FOXO1-PAX3/7 fusions (medNES ≥ 1.04,
MWU adj. p-val (Mann Whitney U test Benjamin-Hochberg adjusted p-value = 7.17e-04) [Davicioni2009],
and T096 WILMS MYO also has significantly higher expression of
NOGGIN (NOG) (logFC = 1.77, FDR = 4.31e-07),
when compared to T092 WILMS [Gerhart2019].
A common classification of Wilms tumors separates them between those with favourable histology
(FHWT) and those with diffuse anaplasia (DAWT); T096 WILMS MYO
is the only Wilms tumor class within our cohort which contains a majority of diffuse anaplasia samples.
The tumors found in T095 MYOGEN FUS- A
separate into three subclasses (Fig MESD1b). Two have are comprised almost exlusively of embryonal
rhabdomyosarcoma (ERMS): T097 RMSARC EMB MYO
(n = 30) which also contains a few presumably fusion-negative ARMS,
and T098 RMSARC EMB MYOD1mut (n = 35) which also includes two spindle cell/sclerotizing rhabdomyosarcoma.
The third cluster is T099 UCS MYO (n = 19),
a small class of UCS.
These classes split by age; as expected T097 RMSARC EMB MYO
and T098 RMSARC EMB MYOD1mut are almost entirely pediatric
(median age 5 y.o. for both), while patients in T099 UCS MYO
are mostly adults (median age 63 y.o.,
KW adj. p-val = 4.30e-05 with 21.06% of pediatric samples,
χ2 p-val = 3.76e-13).
Comparing the two ERMS classes, T097 RMSARC EMB MYO,
and T098 RMSARC EMB MYOD1mut, T097 RMSARC EMB MYO
has a significantly elevated expression of skeletal muscle developmental gene sets
(medNES = 1.15,
KW adj. p-val = 2.61e-07)
and a high expression of muscle genes (Fig. MESD7),
suggesting these tumors comprise a well-differentiated subtype of ERMS [Davicioni2009].
T098 RMSARC EMB MYOD1mut
is characterized instead by high expression of gene sets related to immune activation [Ashburner2000], [TGOC2019],
low expression of skeletal muscle genes - including MYH8 (logFC = 1.13e-06), ACTA1 (logFC = -4.9, FDR = 9.23e-09),
and MYOG (logFC = -1.74, FDR = 2.31e-04) - and enrichment of
PI3K signalling (medNES = 1.11,
MWU adj. p-val (Mann Whitney U test Benjamin-Hochberg adjusted p-value = 4.58e-05) [Schaefer2009],
a gene expression pattern characteristic of RMS with MYOD1 L122R mutations [Kohsaka2014] .
Further gene set enrichment analysis of targets downregulated by MYOD1 LI22R compared to wild type
MYOD1 shows significant underexpression in T098 RMSARC EMB MYOD1mut
compared to both its sibling clusters (medNES ≤ 4.04e-02,
KW adj. p-val = 2.44e-11,
Dunn adj. p-val < 1.00e-04) (Fig. MESD7);
however, we lack any genomic information to confirm this.
When compared to the major uterine carcinosarcoma class T111 UCS (see below for details),
T099 UCS MYO is significantly higher in sarcomatous components
(median 100.00% vs. 70.00, MWU adj. p-val = 8.462e-04)
and heterologous rhabdomyosarcomatous components (mean 23.5% vs. 0.00%,
MWU adj. p-val = 6.13e-04),
while T111 exhibits a higher carcinomatous component (median 1.00% vs. 30.00%,
MWU adj. p-val = 1.03e-02) [Cherniack2017].
T099 UCS MYO
also exhibits significantly higher expression of skeletal muscle genes
MYOD1 (logFC = 6.88, FDR = 7.27e-16) and
MYOG (logFC = 9.55, FDR = 9.30e-17),
conforming with a recently described myogenic subtype of UCS (subtype II) [An2017].
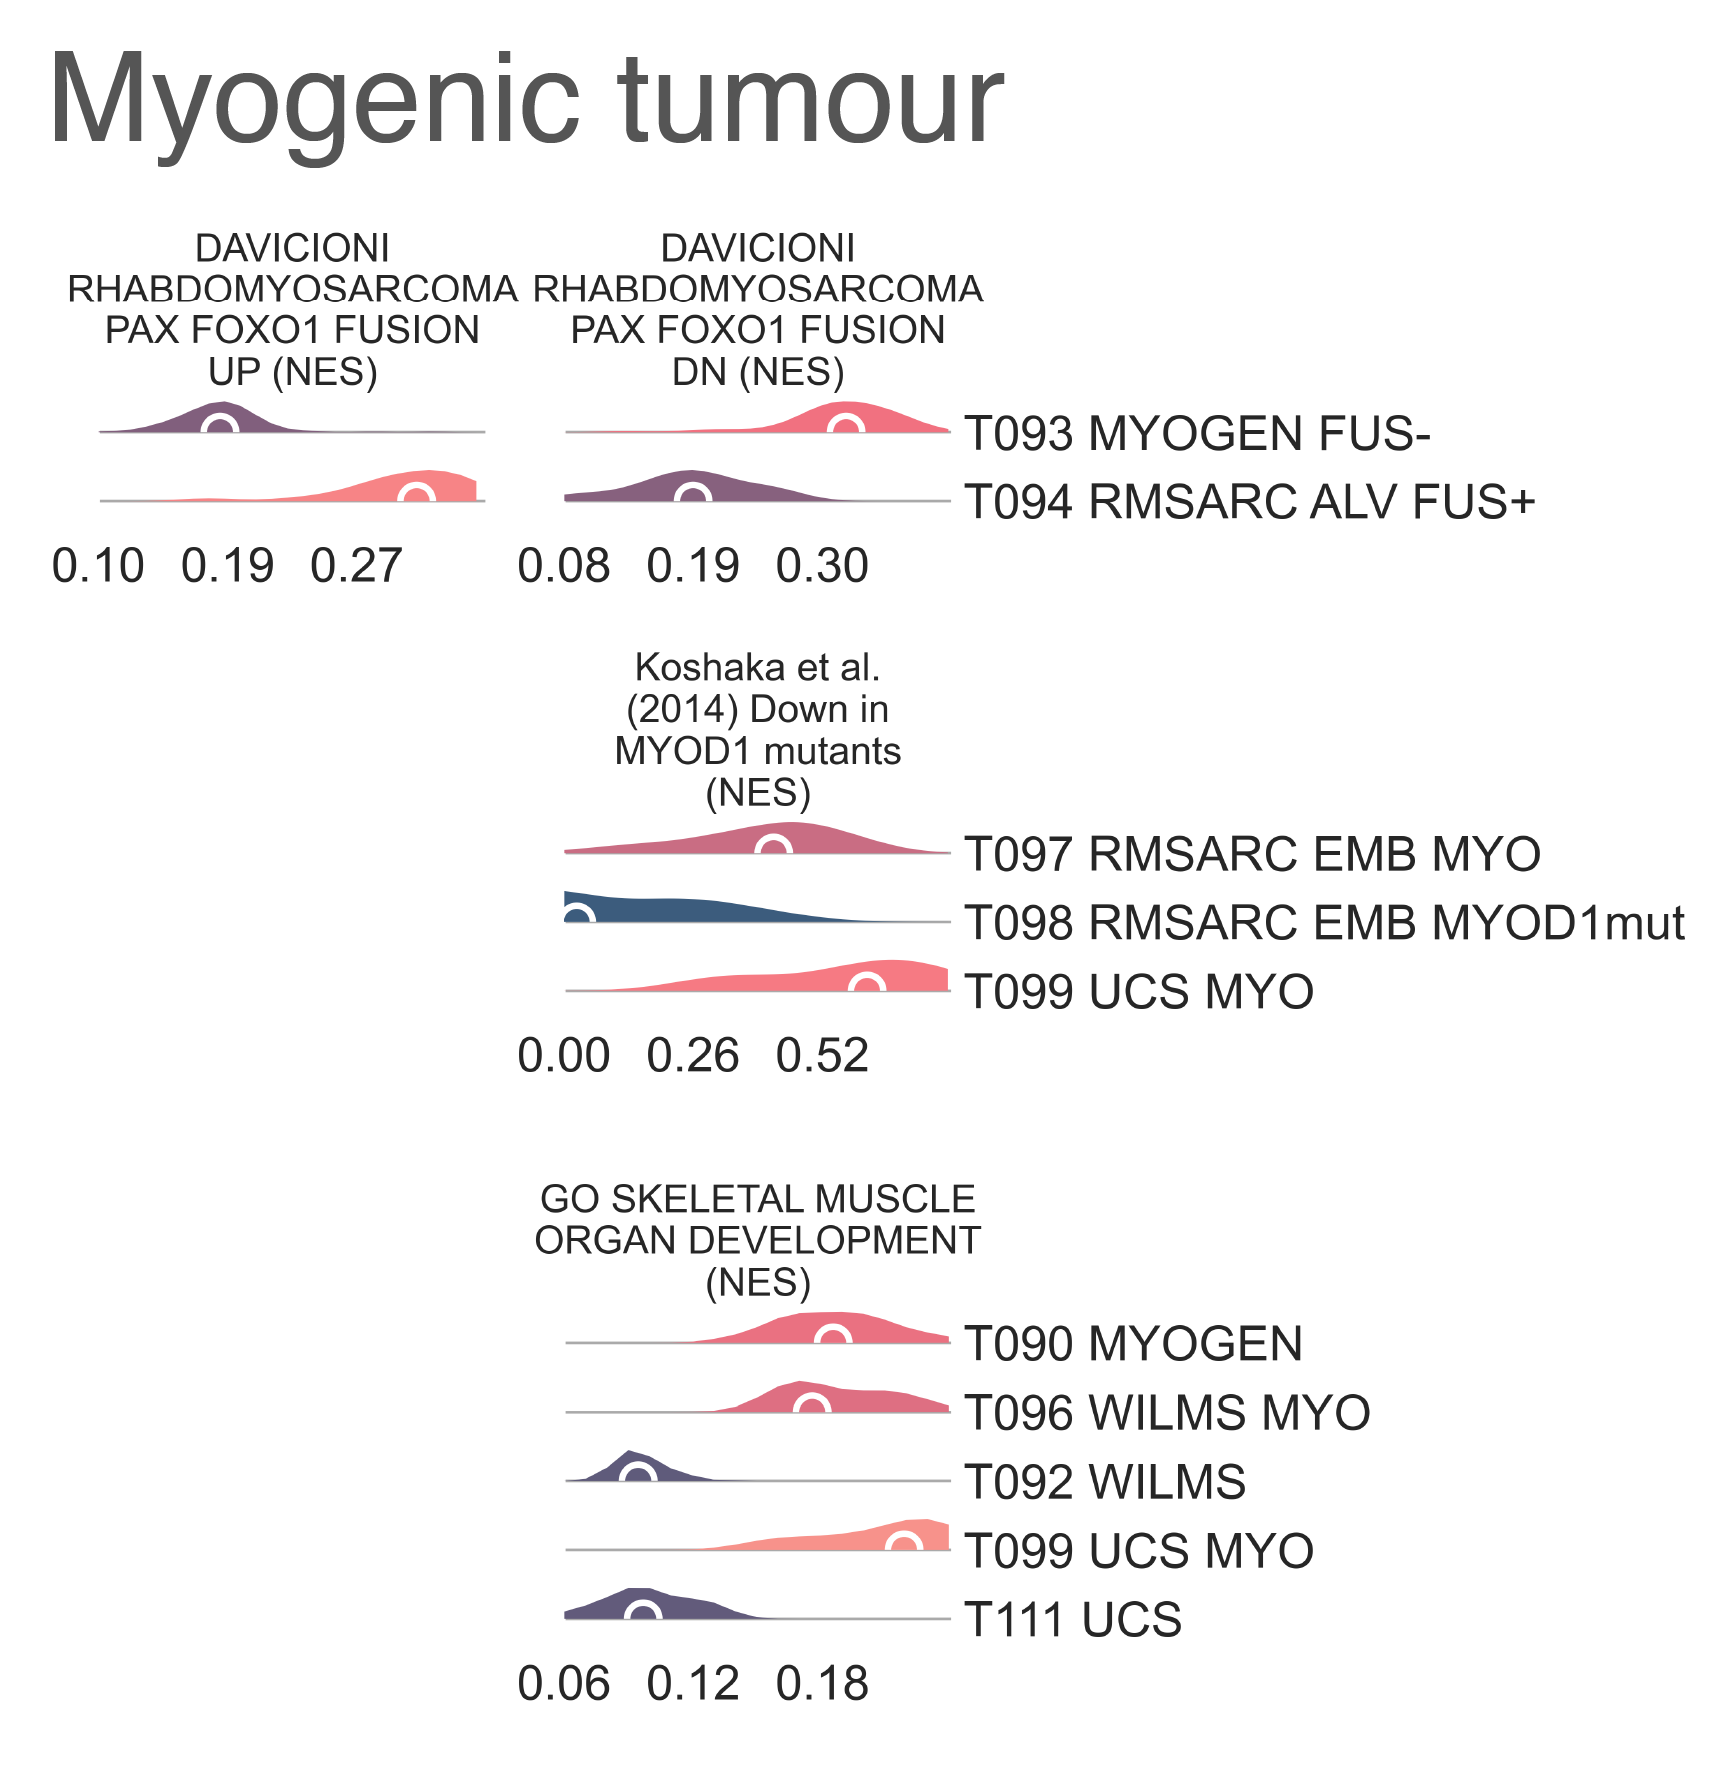
MESD7: Distribution plots of normalized enrichment score of gene sets relevant to the definition of myogenic tumors.
Other sarcoma with high stemness
Following the children of T091 MESODM STEMhigh A, we find 6 different subclasses with a wide variety of diagnoses (Fig. MESD8).
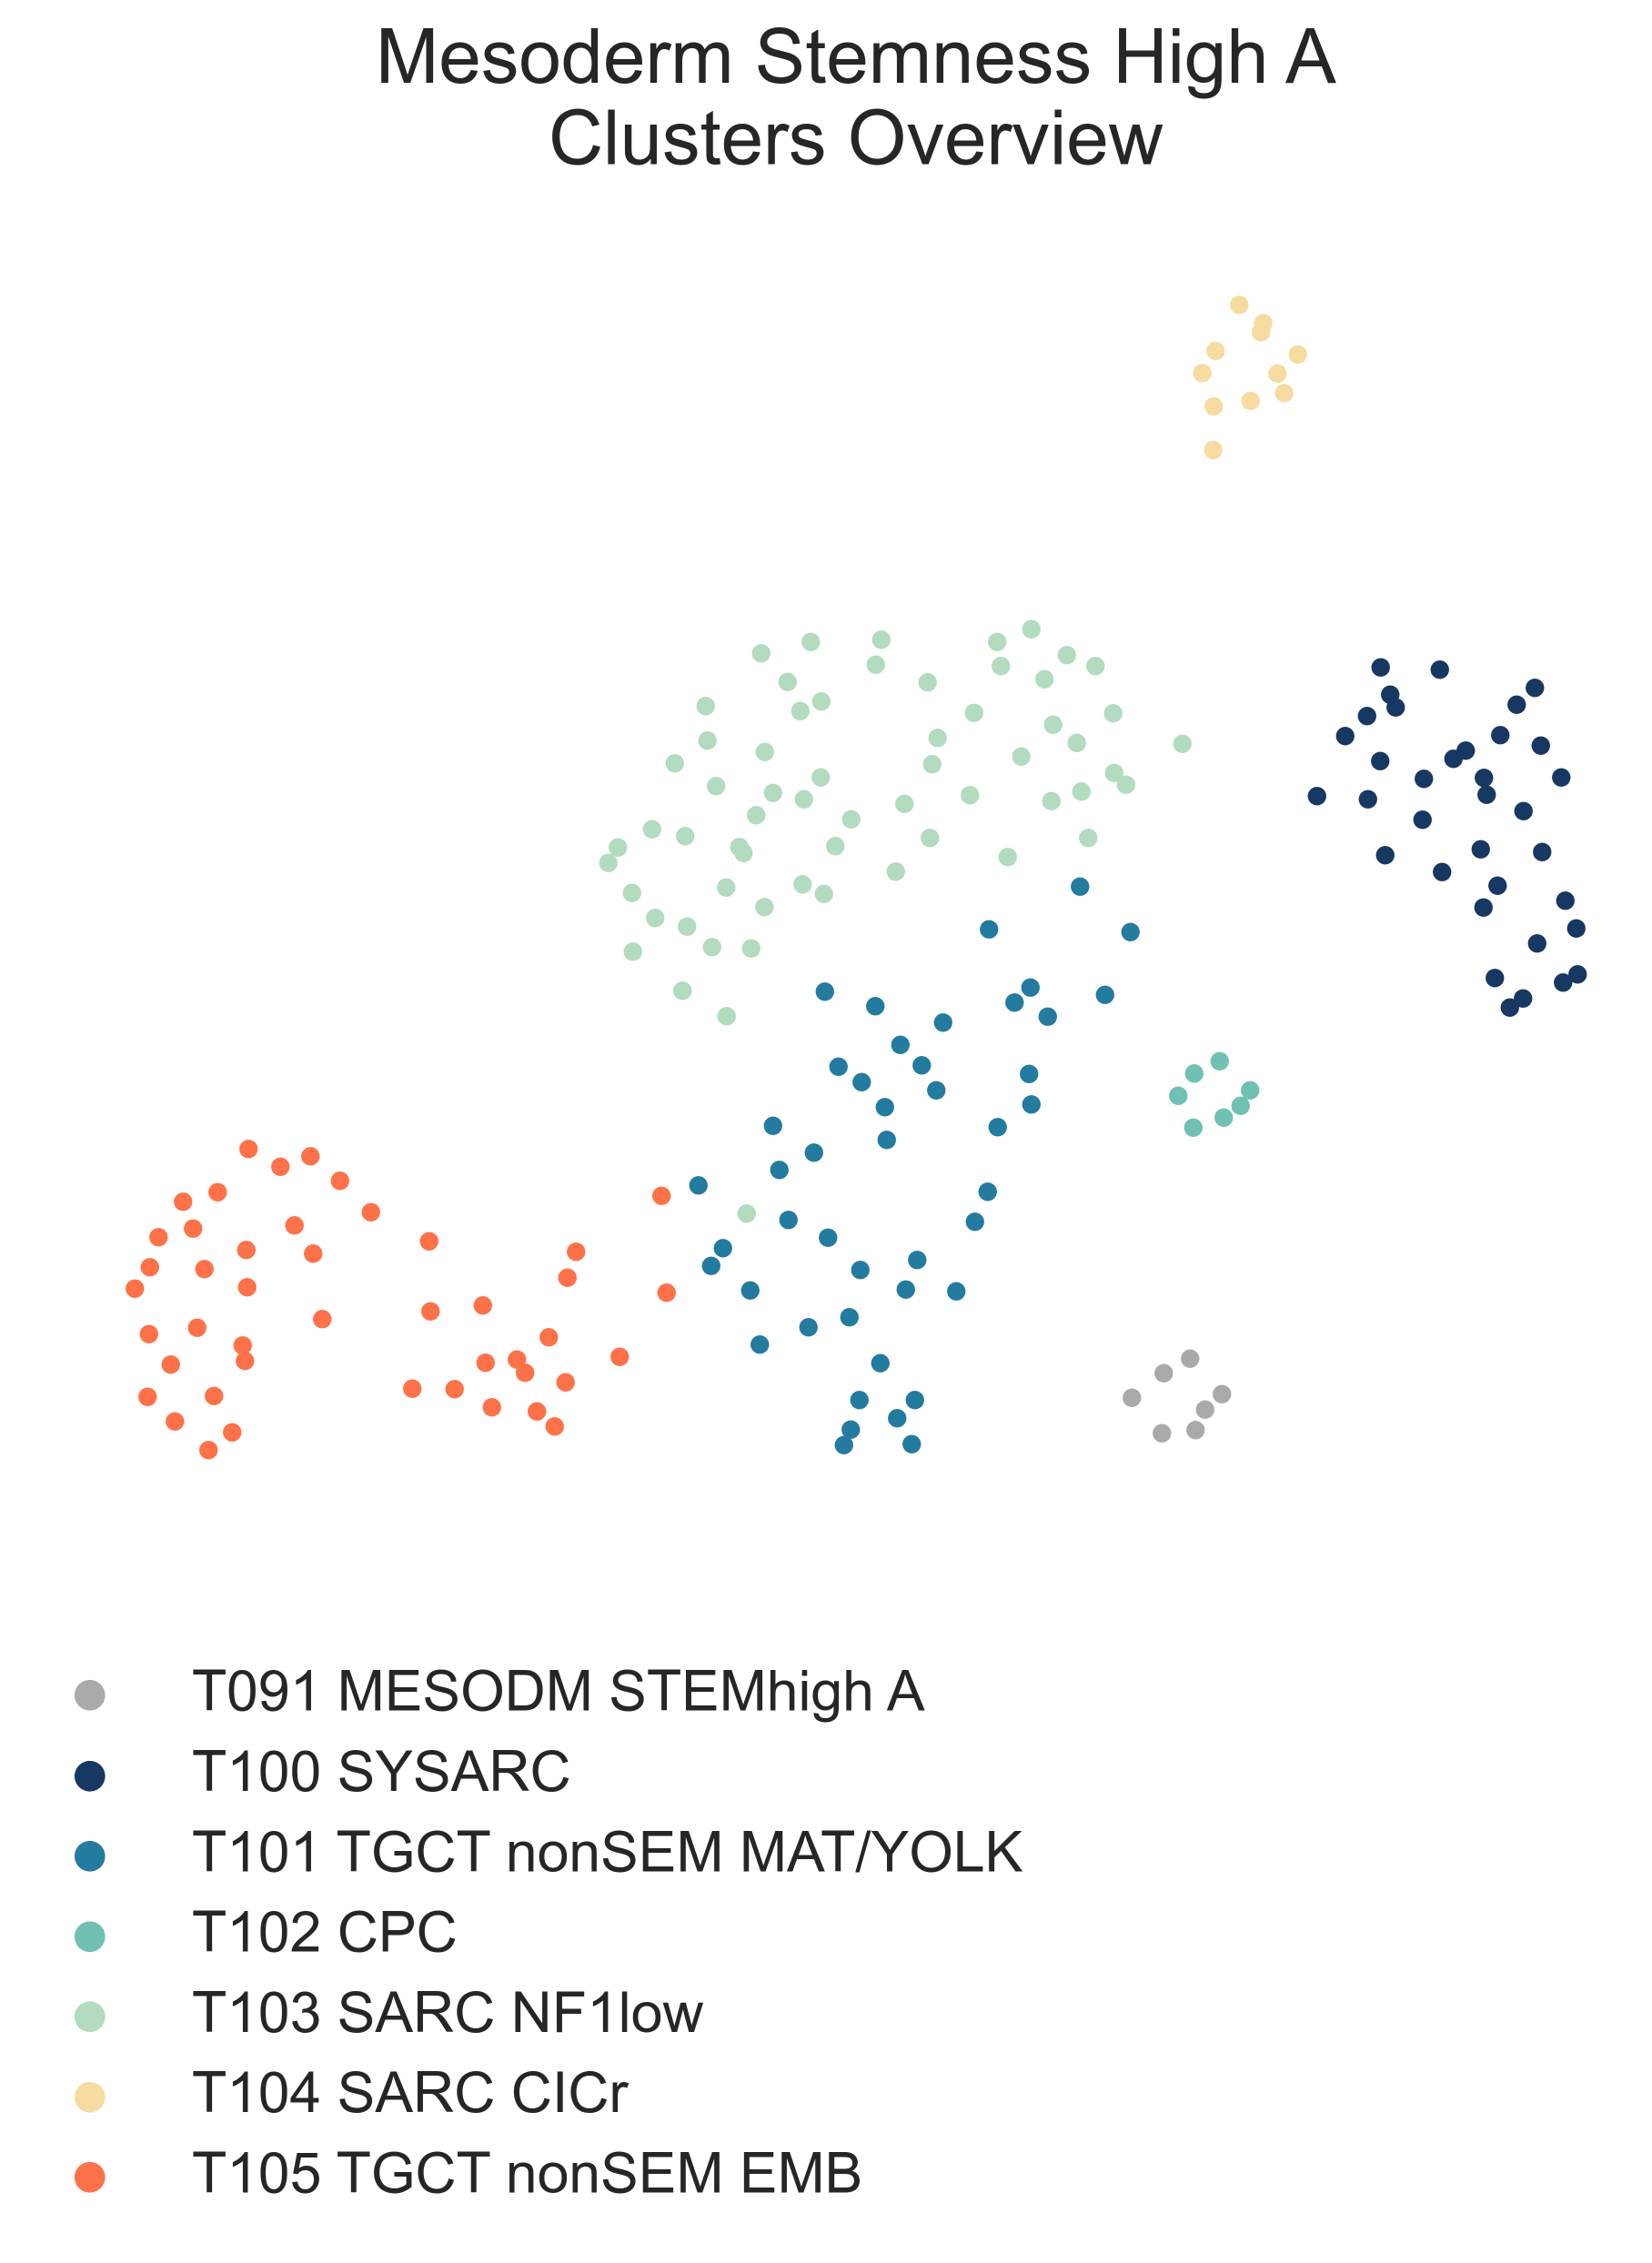
MESD8: a 2-dimensional UMAP projection of mixed sarcoma tumors with high stemness by gene expression. The subtypes identified are shown with different colours.
Some, like T100 SYSARC (n = 37) and T102 CPC (n = 6) are clearly defined by a single tumor type, in this case, synovial sarcoma and choroid plexus carcinoma, respectively. Others, like T104 SARC CICr (n = 21), are composed of samples of disparate origins brought together by specific lesions. This is an exemplary case and is similar to that of BCOR altered samples within the CNS branch, here both CNS malignancies and sarcomas carrying CIC-DUX4 fusions (Fig. MESD9).
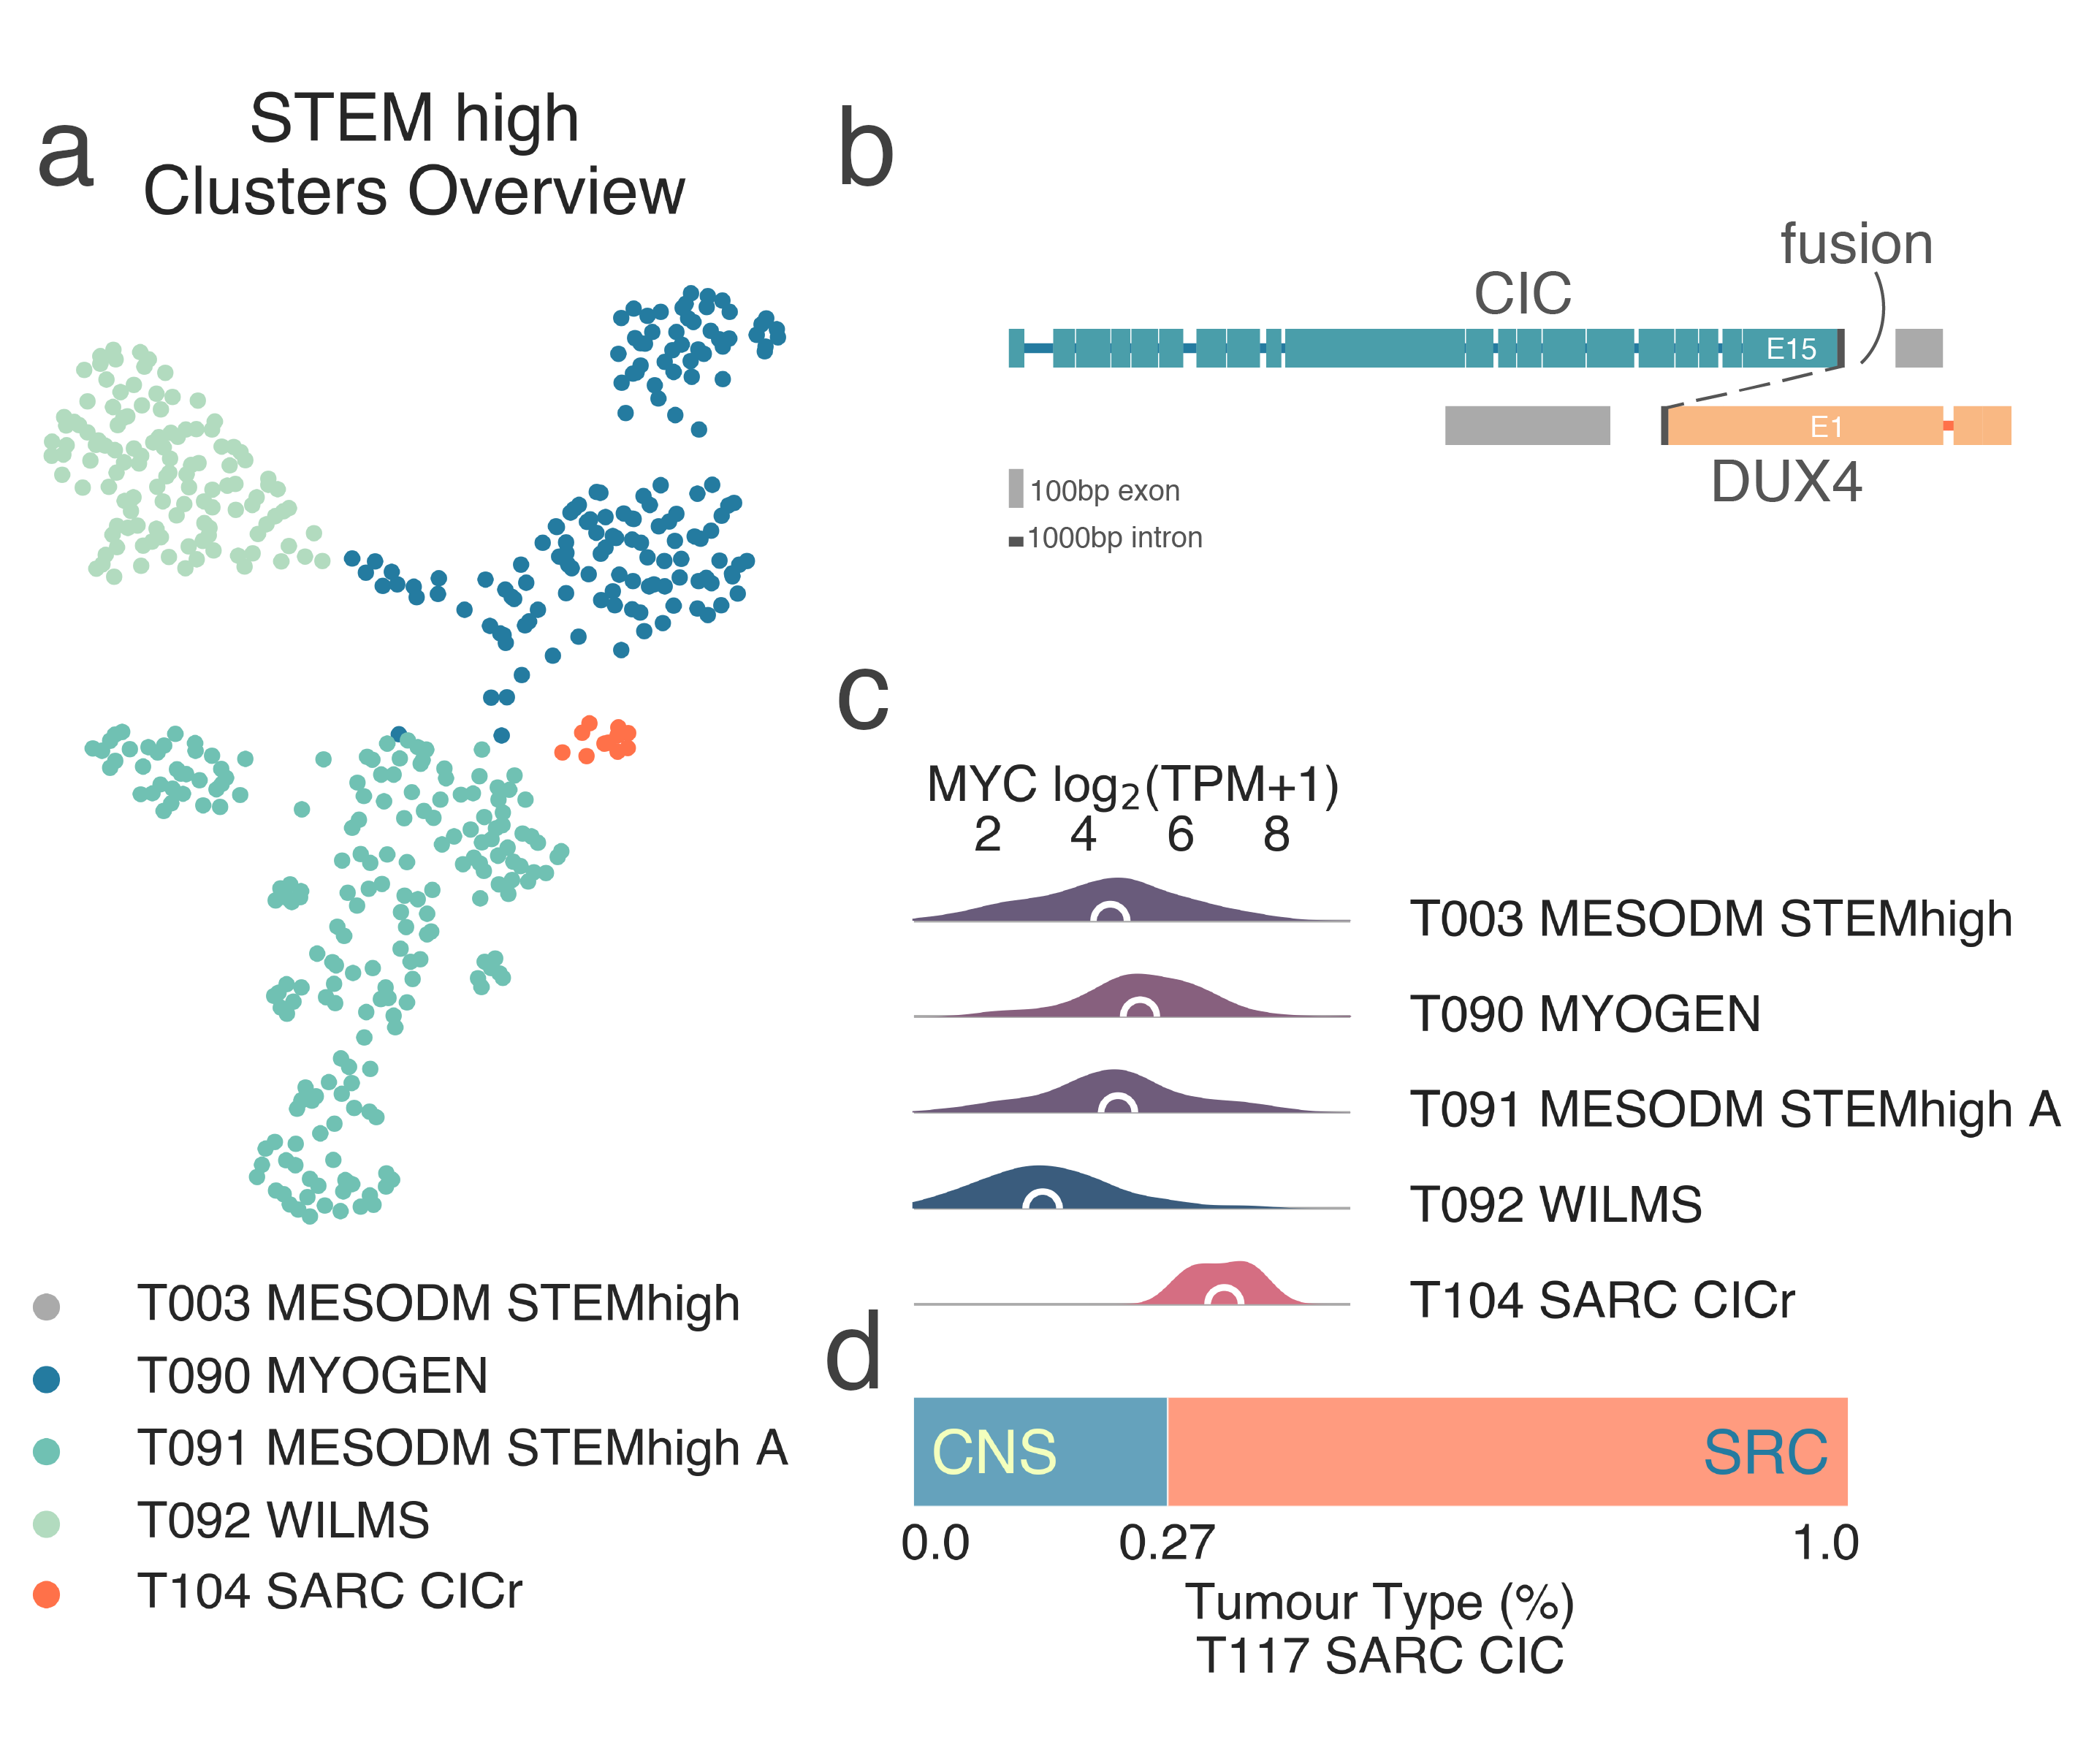
MESD9: A, 2-dimensional UMAP projection of mixed sarcoma tumors with high stemness by gene expression. The subtypes identified are shown with different colours, CIC-mutant tumors are shown in red. B, schematic representation of a typical CIC-DUX4 fusion event. C, distribution plots of MYCN expression high-stemness sarcoma subtypes. D, tumor type composition of the T104 SARC CICr class.
Gene set enrichment analysis of this cluster revealed both significant enrichment of upregulated targets (medNES ≤ 1.07, KW adj. p-val = 2.36e-18) and significant paucity of downregulated targets (medNES ≥ 8.34e-01, KW adj. p-val = 7.29e-11) in CIC-DUX4 fusion-positive round cell tumors [Specht2014], [Yoshimoto2017] ((Fig. MESD10). T104 SARC CICr also exhibits overexpression of MYC (median logFC = 2.47, FDR ≤ 1.39e-06) (Fig. MESD9d), frequently amplified in CIC rearranged tumors [Smith2015], as well as its canonical downstream effector CDKN1A (median logFC = 2.69, FDR ≤ 5.70e-09). The class includes a few samples labelled as Ewing sarcoma, which are likely misdiagnosed.
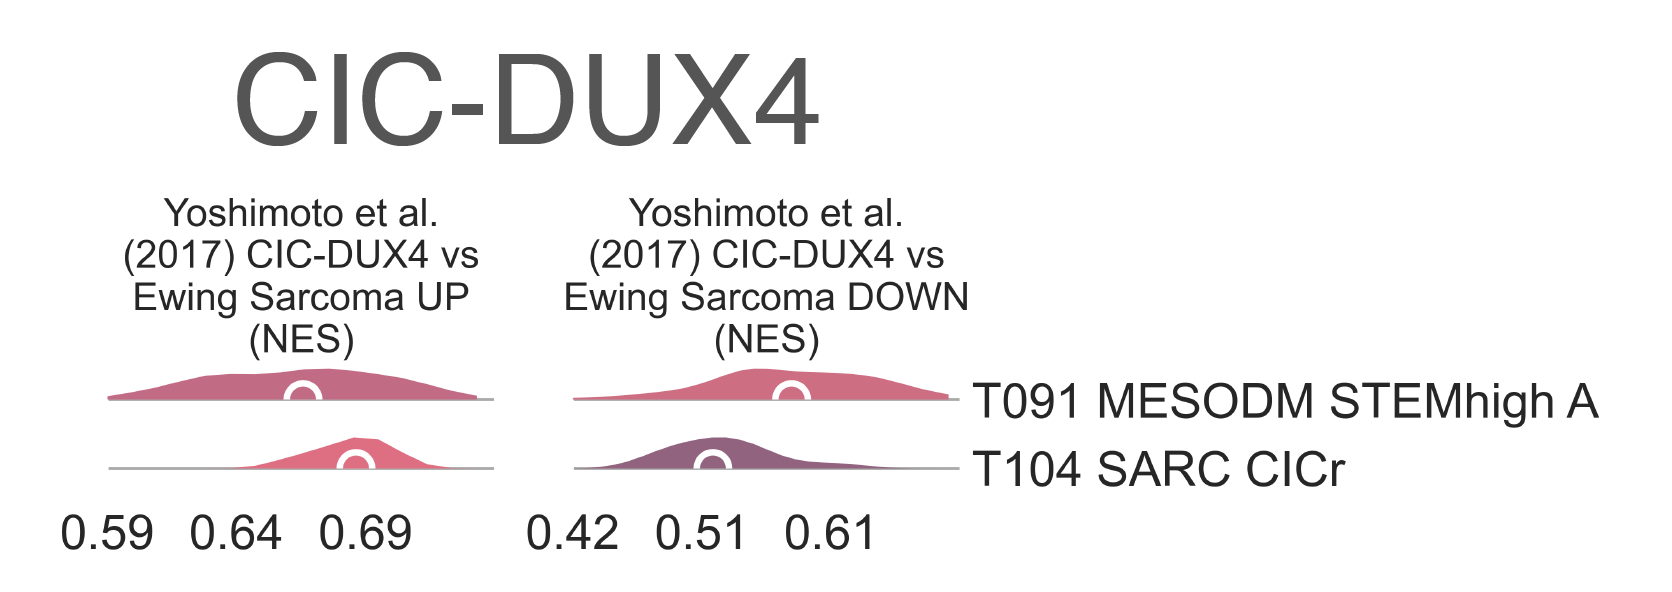
MESD10: Distribution plots of normalized enrichment score of gene sets relevant to the definition of CIC-mutated tumors.
T103 SARC NF1low (n = 47) contains the majority of UCS in our dataset,
along with a few retroperitoneal DDLPS,
MPNST (malignant peripheral nerve sheath tumor), two ovarian serous cystadenocarcinomas, and uterine corpus endometrial carcinomas,
among other tumor types. This then divides roughly by diagnosis: UCS
samples are clustered into T111 UCS (n = 37) at the next level (Fig. MESD1b),
separating them from all other malignancies, which are found in T110 SARC NF1mut (n=25).
When compared to the myogenic UCS
cluster T099 UCS MYO,
we observe higher expression of cell adhesion and apoptotic genes, SIPA1L1
(logFC = 1.33, FDR = 7.290e-08),
STAT6 (logFC = 0.846, FDR = 4.461e-02),
CASP6 (logFC = 1.01, FDR = 2.585e-05),
and CASP8 (logFC = 0.702, FDR = 4.084e-02) in T111 UCS,
associated with a recently described UCS group (subtype I)[An2017]_.
T110 SARC NF1mut contains a majority of
MPNST and DDLPS
(n = 4 each), which seem to be characterized by a loss of NF1. This explains the marked separation of this group
from the majority of these diagnoses, which are found in T069 SARC STEMlow in the entirely different mesodermal tumor family.
We observe highly significant enrichment of genes upregulated in NF1 mutants and impoverishment of genes
downregulated by the same lesions between all diagnoses included within T110 SARC NF1mut
and their counterparts in all other clusters (medNES ≥ 1.26,
MWU adj. p-val (Mann Whitney U test Benjamin-Hochberg adjusted p-value` ≤ 6.53e-07) (Fig. MESD11),
and more specifically between MPNST and DDLPS
in T110 SARC NF1mut vs. T069 SARC STEMlow
(medNES ≥ 1.33,
MWU adj. p-val (Mann Whitney U test Benjamin-Hochberg adjusted p-value` ≤ 6.25e-04) [Pemov2020].
As T110 SARC NF1mut contains tumors from markedly different lineages,
including two glioblastoma multiformes and three melanomas, it is likely this class contains
NF1 mutant tumors regardless of their tissue of origin, similarly to what observed for
BCOR altered samples in CNS and CIC-fusion samples ([Kiuru2017]; [Costa2019]; [Kim2020]).
We observe no significant difference in these downstream NF1 gene sets, between T110 SARC NF1mut
and T111 UCS (p-val ≥ 3.80e-01), suggesting this expression pattern
is characteristic of their whole parent class T103 SARC NF1low.
Within T111 UCS, only one sample is reported as NF1 mutated - the only case in the
TCGA UCS cohort [Cherniack2017] - possibly suggesting a role of
NF1 in UCS regardless of its mutation status.
Interestingly, when comparing T111 UCS with T099 UCS MYO
and its parent cluster T093 MYOGEN FUS-, only the downregulated targets of
NF1 mutations are significantly lower (KW adj. p-val = 2.40e-05
and 6.30e-01 vs. T099 UCS MYO, 6.22e-03 and 6.97e-01 vs.
T093 MYOGEN FUS-).
This is possibly due to the reported role of NF1 in myogenesis [Kossler2011],
and suggests that only the loss of expression in downstream target may be the specific marker of NF1 alterations in these malignancies.
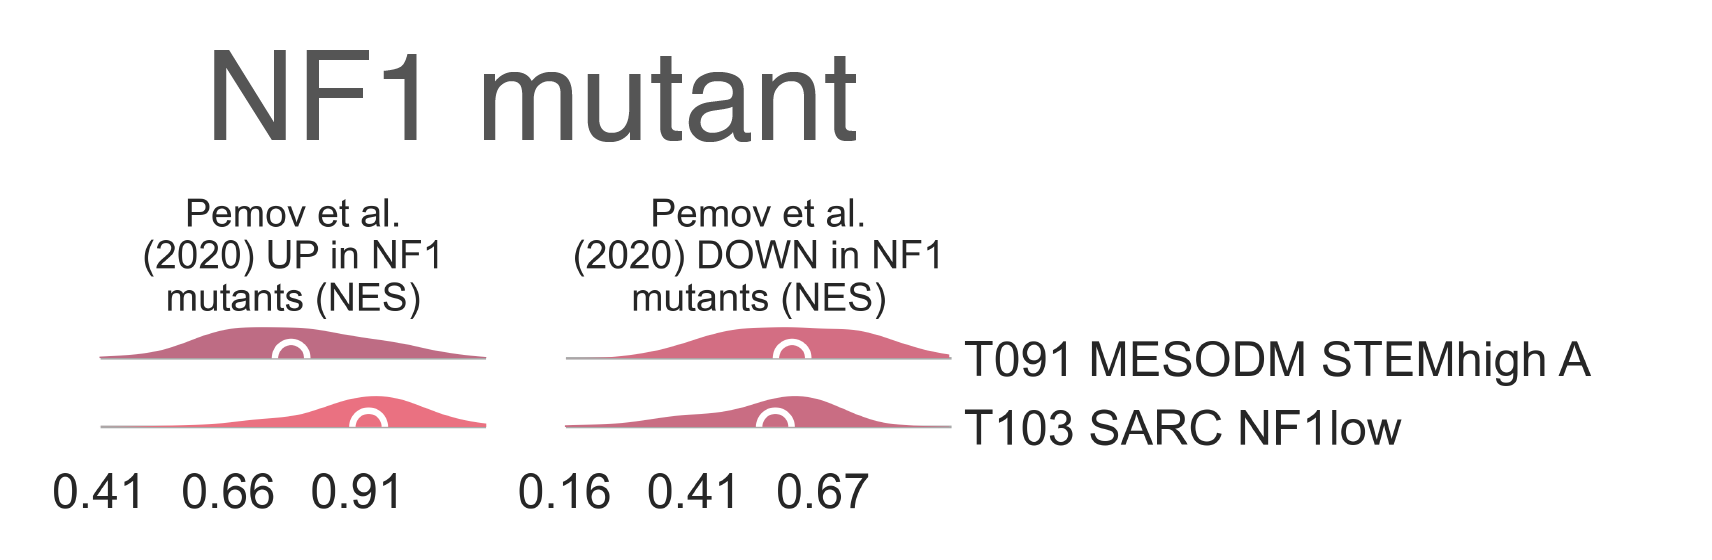
MESD11: Distribution plots of normalized enrichment score of gene sets relevant to the definition of NF1-mutated tumors.
Testicular tumor
Within the child classes of T093 MYOGEN FUS- we find two separate groups of
:abbr:` TGCT NON-SEM (testicular germ cell tumor non-seminomas)` (Fig. MESD1b).
T101 (n = 45) is composed of
both mature teratoma and yolk sac tumors, as evident both from clinical annotation (χ2 p-val ≤ 3.67e-02)
and tissue type percentage information (MWU adj. p-val
contains embryonal carcinoma-rich tumors, gleaned from both from clinical annotation (0 vs. 27/39, χ2 p-val = 1.21e-07)
and tissue composition (MWU adj. p-val exhibits elevated
AFP expression (logFC = 2.23, FDR = 8.421e-03), while
T105 TGCT nonSEM EMB overexpresses
lactate dehydrogenase genes (4/6, FDR < 1.00e-6) and CGB (β-HCG) genes (4/5, FDR < 1.00e-04).
T105 TGCT nonSEM EMB
is highly enriched for an embryonal carcinoma gene sets (medNES = 216.80,
MWU adj. p-val, while
T101 is enriched for yolk sac gene sets
(medNES = 2.06, MWU adj. p-val then divides into four separate
subtypes which fall along on a spectrum of differentiation from yolk sac to mature tumors
(KW adj. p-val < 1.00e-04)
(Fig. MESD12). Indeed, we observe T108 TGCT nonSEM YOLK H
(n = 13) carrying yolk sac and yolk sac dominant samples with the highest percentage of yolk sac tissue (median 95.00%) and lowest of mature tissue (0.00%),
T107 TGCT nonSEM YOLK I (n = 9), being just below
(yolk sac 42.50%, mature 25.00%), T109 TGCT nonSEM MAT I (n = 10)
containing mature teratoma dominant samples with low yolk sac content (10.0%) and a considerably higher mature tissue component (65.00%),
and finally T106 TGCT nonSEM MAT H (n = 13) containing samples showing the
lowest yolk sac (2.00%) and highest maturate tissue (95.00%) content [Shen2018].
This separation is further confirmed in the case of T108 TGCT nonSEM YOLK H by gene sets,
where we see an enrichment of yolk sac tumors genes
(medNES = 2.26,
KW adj. p-val = 6.21e-05) [Korkola2006].
T105 TGCT nonSEM EMB, containing TGCT
of the embryonal subtype, splits into two subclasses. T112 TGCT nonSEM EMB I
(n = 20) contains samples with mixed clinical annotation, while T113 TGCT nonSEM EMB H
(n = 25) is composed almost entirely of samples marked as embryonal.
The embryonal carcinoma percentages (median 40.00% vs. 100.00%, MWU adj. p-val = 5.11e-05)
further the idea of a continuous spectrum of tissue type between these clusters, analogous to what we observed in the subtypes of
T101. Here,
T113 TGCT nonSEM EMB H
contains samples almost exclusively composed of embryonal tissue, while
T112 TGCT nonSEM EMB I contains samples with a more intermediate component.
This is confirmed by gene set enrichment, where T112 TGCT nonSEM EMB I
is enriched for yolk sac and teratoma gene sets (medNES ≥ 1.24
MWU adj. p-val
while T113 TGCT nonSEM EMB H
is enriched for an established embryonal carcinoma gene sets (medNES = 1.04,
MWU adj. p-val [Korkola2005].
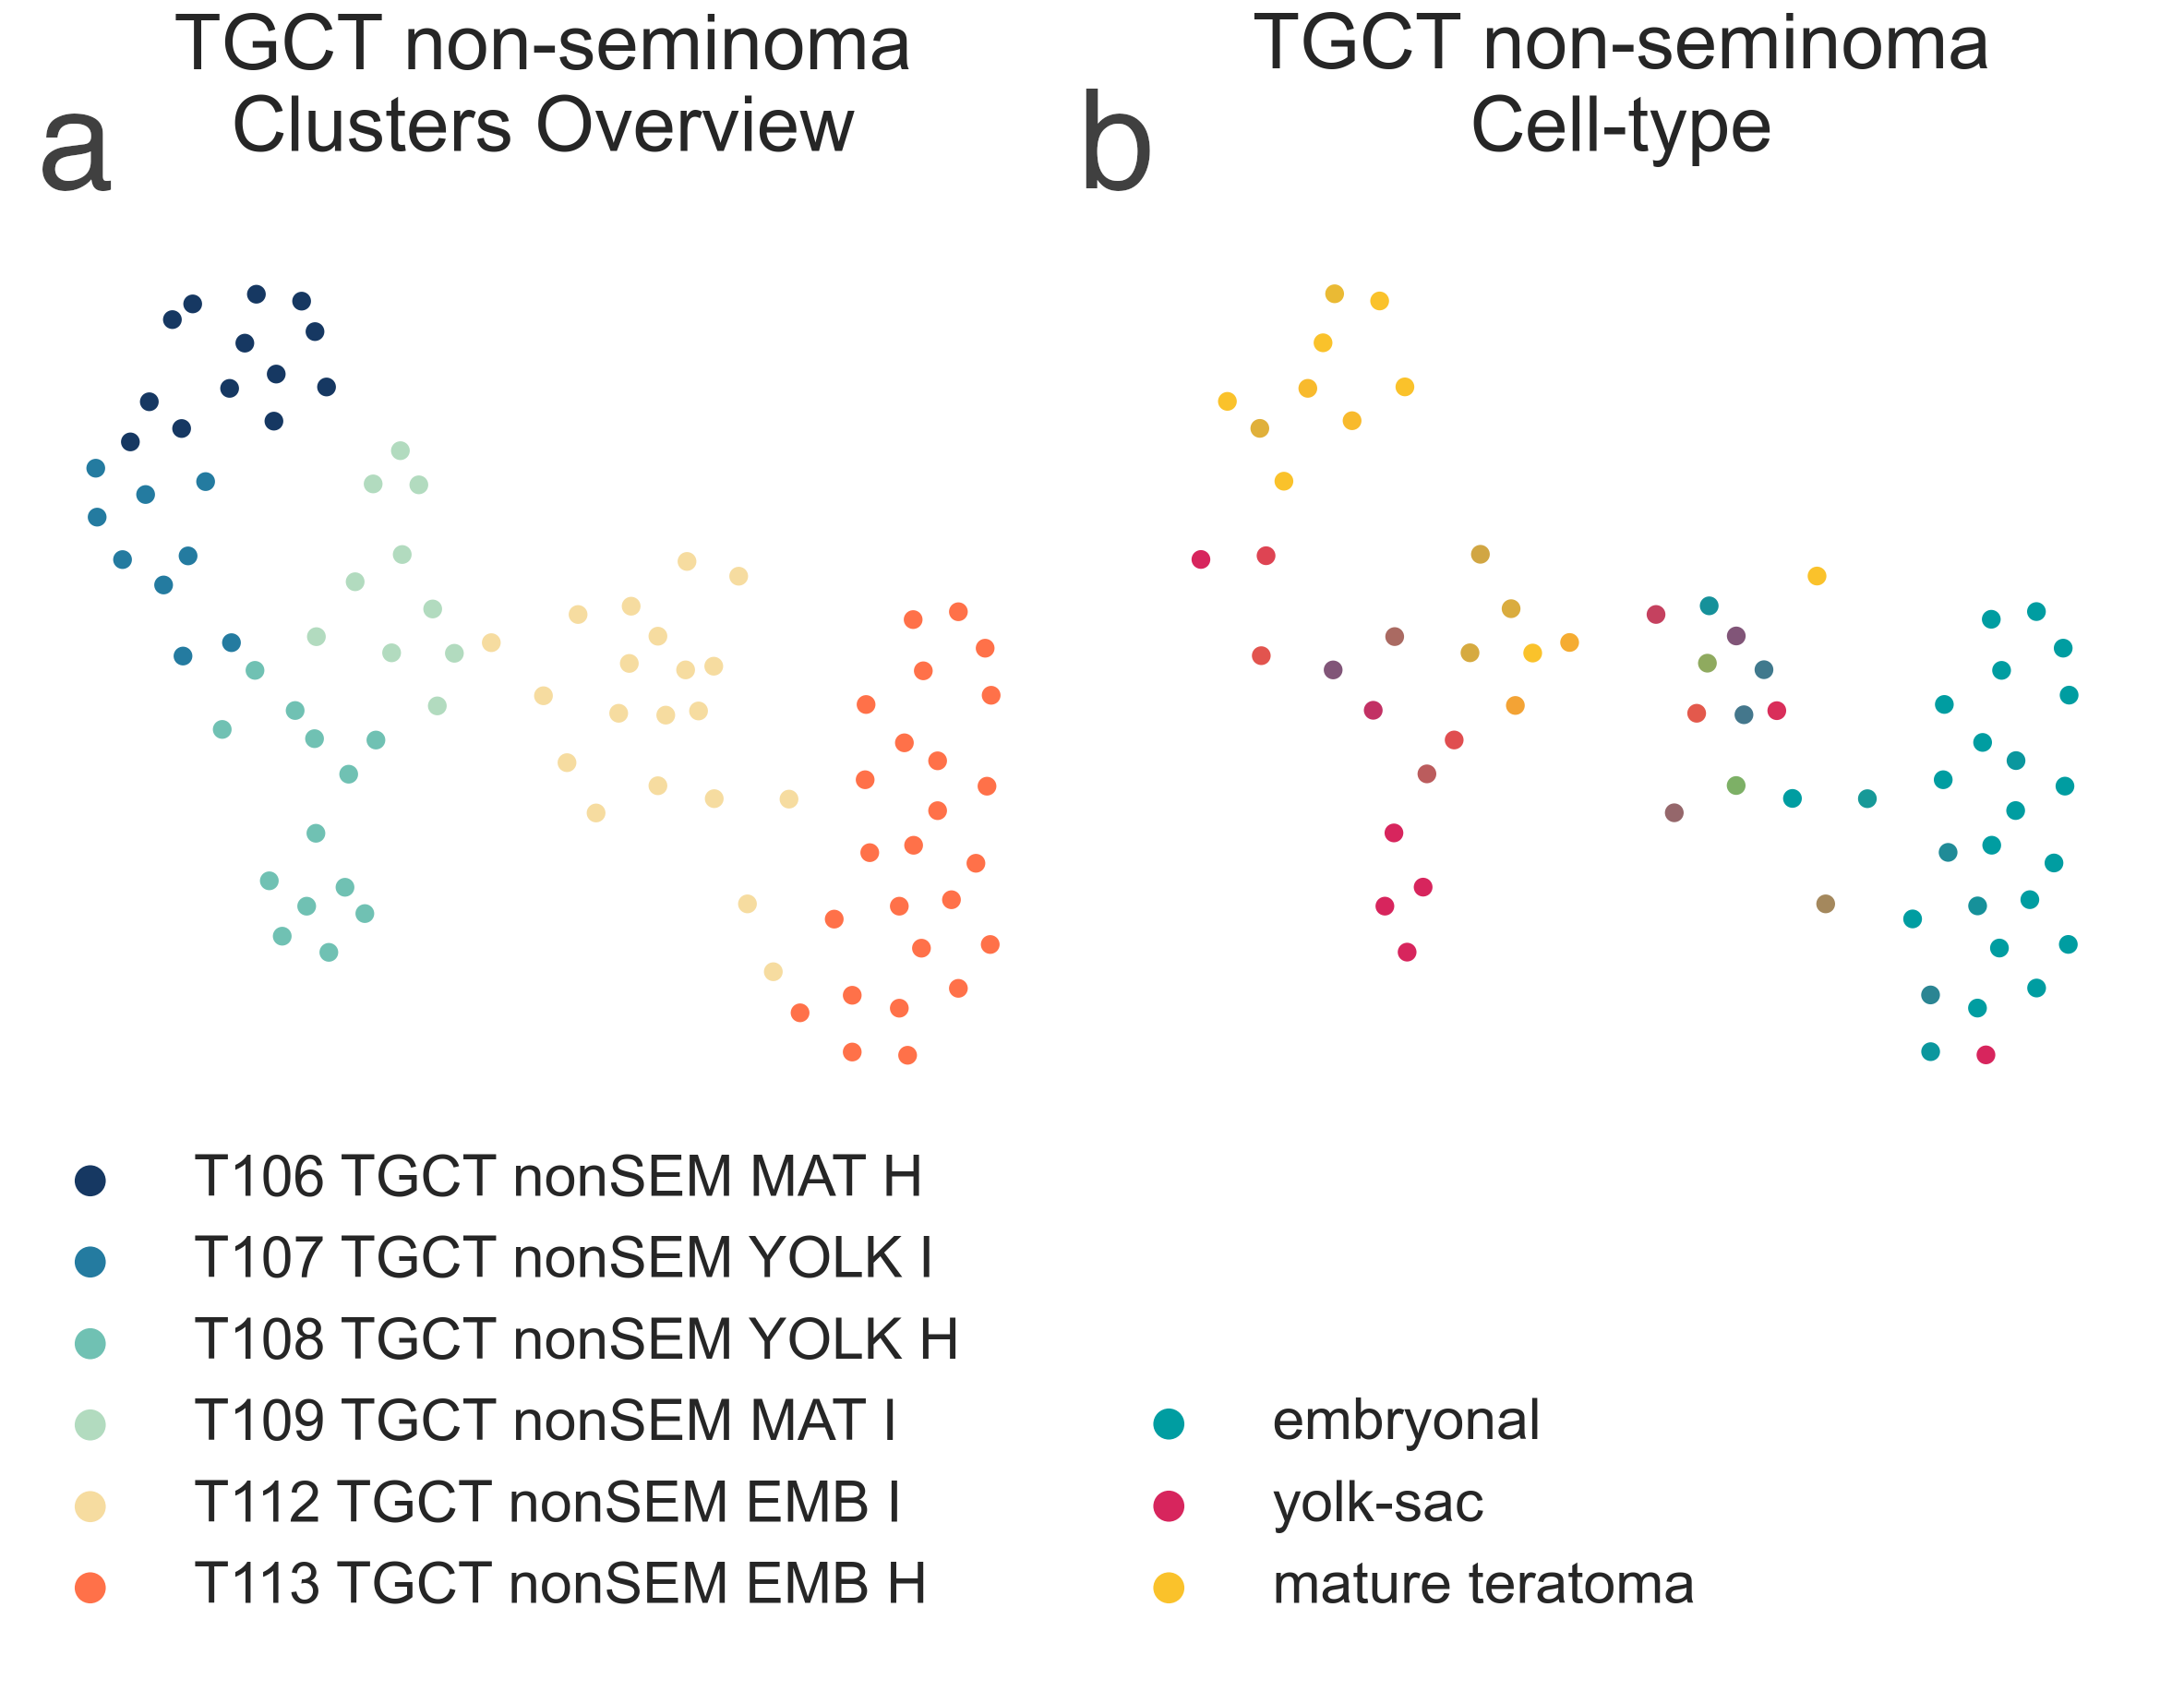
MESD12: 2-dimensional UMAP projection of TGCT by gene expression. On the left, the subtypes identified are shown with different colours. On the right, samples are coloured by their relative proprtion of cell populations by type and level of maturation.
Wilms Tumour
When comparing the major Wilms tumor cluster T092 WILMS to
T099 UCS MYO, we observe significantly higher expression
of metanephrogenic genes PAX2 (logFC = 1.81, FDR = 1.03e-07),
OSR1 (logFC = 1.77, FDR = 9.07e-04), EYA1 (logFC = 1.44,
FDR = 1.17e-06), MEOX1 (logFC = 1.13, FDR = 2.269e-03),
and SALL2 (logFC = 0.96, FDR = 3.962e-04) [Li2002],
suggesting these tumors to have an expression profile closer to the kidney.
T092 WILMS then divides into 5 different subtypes with characteristic transcriptional profiles (Fig. MESD1b),
in line with FHWT transcriptional clusters recently described by a joint COG-TARGET initiative [Gadd2017].
Importantly, we observe a mixture of both FHWT
and DAWT categories across all classes; however, all our bona
fide Wilms subtypes (children of T092 WILMS ) have significantly higher proportion of FHWT,
apart from T117 WILMS KDEV which is evenly divided.
T096 WILMS MYO is the only Wilms tumor group to have a higher DAWT
component (see section on the Myogenic tumor group) and is the only one composed exclusively of histologically mixed tumors [Gadd2017].
T114 WILMS PI3K/MTOR (n=11) is the smallest cluster and is
exclusively composed of COG-TARGET FHWT
expression cluster 2 samples (χ2 p-val = 5.587e-07) [Gadd2017]
and is defined by significant enrichment of gene sets related to PI3K-mTOR signalling
(medNES ≥ 1.01,
KW adj. p-val = 4.14e-04)
and the interferon response (medNES ≥ 1.06,
KW adj. p-val = 1.32e-04)
(Fig. MESD13). It also exclusively contains SIX1/2 mutants (n = 5 and 4, respectively).
Furthermore, it has the greatest proportion of blastemal samples (6/7, χ2 p-val = 5.74e-04) [Gadd2017].
T115 WILMS OXYPHO ≥ 1.06,
KW adj. p-val = 1.13e-08,
Dunn adj. p-val < 1.00e-02)
and low expression of mitotic spindle related sets (medNES ≥ 0.90,
KW adj. p-val = 6.03e-10,
Dunn adj. p-val < 1.00e-03) [Liberzon2015]
(Fig. MESD13), which is similar to COG-TARGET cluster 5 [Gadd2017].
That T115 WILMS OXYPHO is the only cluster to contain expression class 5
FHWT samples (χ2 p-val = 2.03e-3)
confirms this identity, though it also contains an equal number of expression class 1 and class 2 samples.
Like T114 WILMS PI3K/MTOR,
T115 WILMS OXYPHO is also composed of a majority of blastemal samples (11/17) [Gadd2017].
T116 WILMS EMT (n = 26) is defined by enrichment of gene sets related to
EMT (medNES ≥ 1.07,
KW adj. p-val = 2.41e-08,
Dunn adj. p-val < 5.00e-02) and
angiogenesis (medNES ≥ 1.07,
KW adj. p-val = 2.30e-06) [Liberzon2015]
(Fig. MESD13).
It also exhibits the lowest expression of WT1 amongst its siblings (median logFC = -1.24,
FDR ≤ 1.30e-02). It should be noted that this expression profile also corresponds to
T096 WILMS MYO, with these two classes corresponding to the profile of COG-TARGET cluster 4.
However, while T116 WILMS EMT is composed of a majority of expression class 3 samples
(13/23, χ2 p-val = 6.806e-05), it and T096 WILMS MYO
contain the largest expression class 4 components (n = 3 each).
T116 WILMS EMT is composed mainly of mixed tumors (15/23),
and also contains the majority of FHWT samples marked as having WT1 loss
(χ2 p-val = 3.04e-02) [Gadd2017].
T117 WILMS KDEV (n = 23) is defined by enrichment
of the estrogen (medNES ≥ 1.07, KW adj. p-val ≤ 1.67e-06) and androgen responses (medNES ≥ 1.05, KW adj. p-val = 7.38e-04, Dunn adj. p-val < 5.00e-02) and notch signalling (medNES ≥ 1.04, KW adj. p-val = 3.97e-08) [Liberzon2015]; consequently, gene sets for kidney development relating to the ureteric metanephric mesenchyme (medNES ≥ 1.54, KW adj. p-val = 4.68e-04, Dunn adj. p-val < 1.00e-02) and loop of Henle (medNES ≥ 8.11, KW adj. p-val = 1.25e-08) ([Ashburner2000]; [TGOC2019]) are also upregulated (Fig. S24e).
It is the only cluster to contain COG-TARGET expression class 6 samples (n = 3, χ2 p-val = 2.61e-04)
but contains a higher amount of class 3 samples (n = 6). It contains the highest number of TP53 mutants, and is
composed entirely of mixed and epithelial tumors (5/9 and 4/9, respectively) [Gadd2017].
Finally, T118 WILMS E2F (n = 26) is defined by enrichment cell proliferation sets,
including the G2M checkpoint (medNES = 1.01,
KW adj. p-val = 6.39e-03)
and mitotic spindle (medNES = 1.03
KW adj. p-val = 6.03e-10) [Liberzon2015],
as well as genesets for E2F (E2F6 KW adj. p-val = 7.86e-03,
and E2F1 activity (KW adj. p-val = 5.82e-06)
[ENCODE2012], and histone modifications (Fig. S24e).
Given its enrichment for E2F signalling and proliferative gene sets, T118 WILMS E2F
corresponds to COG-TARGET cluster 1. Indeed, it is the only cluster to be composed of a majority of expression class 1 samples
(14/17, χ2 p-val = 1.927e-05). Its samples exhibit variable histology, with a majority of samples being blastemal
(8/17), with smaller mixed (5/7) and epithelial (4/17) components.
Although no differences in survival reached significance between any of the clusters (lrt p-val = 7.40e-02 at 4795 days),
T118 WILMS E2F exhibits the worst overall survival and is the only cluster to
reach median OS (1229 days post-diagnosis).
Our clusters of Wilms tumors seem to represent a spectrum of differentiation from blastemal
through mixed to epithelial tumors, similar to the TGCT NO-SEM described previously.
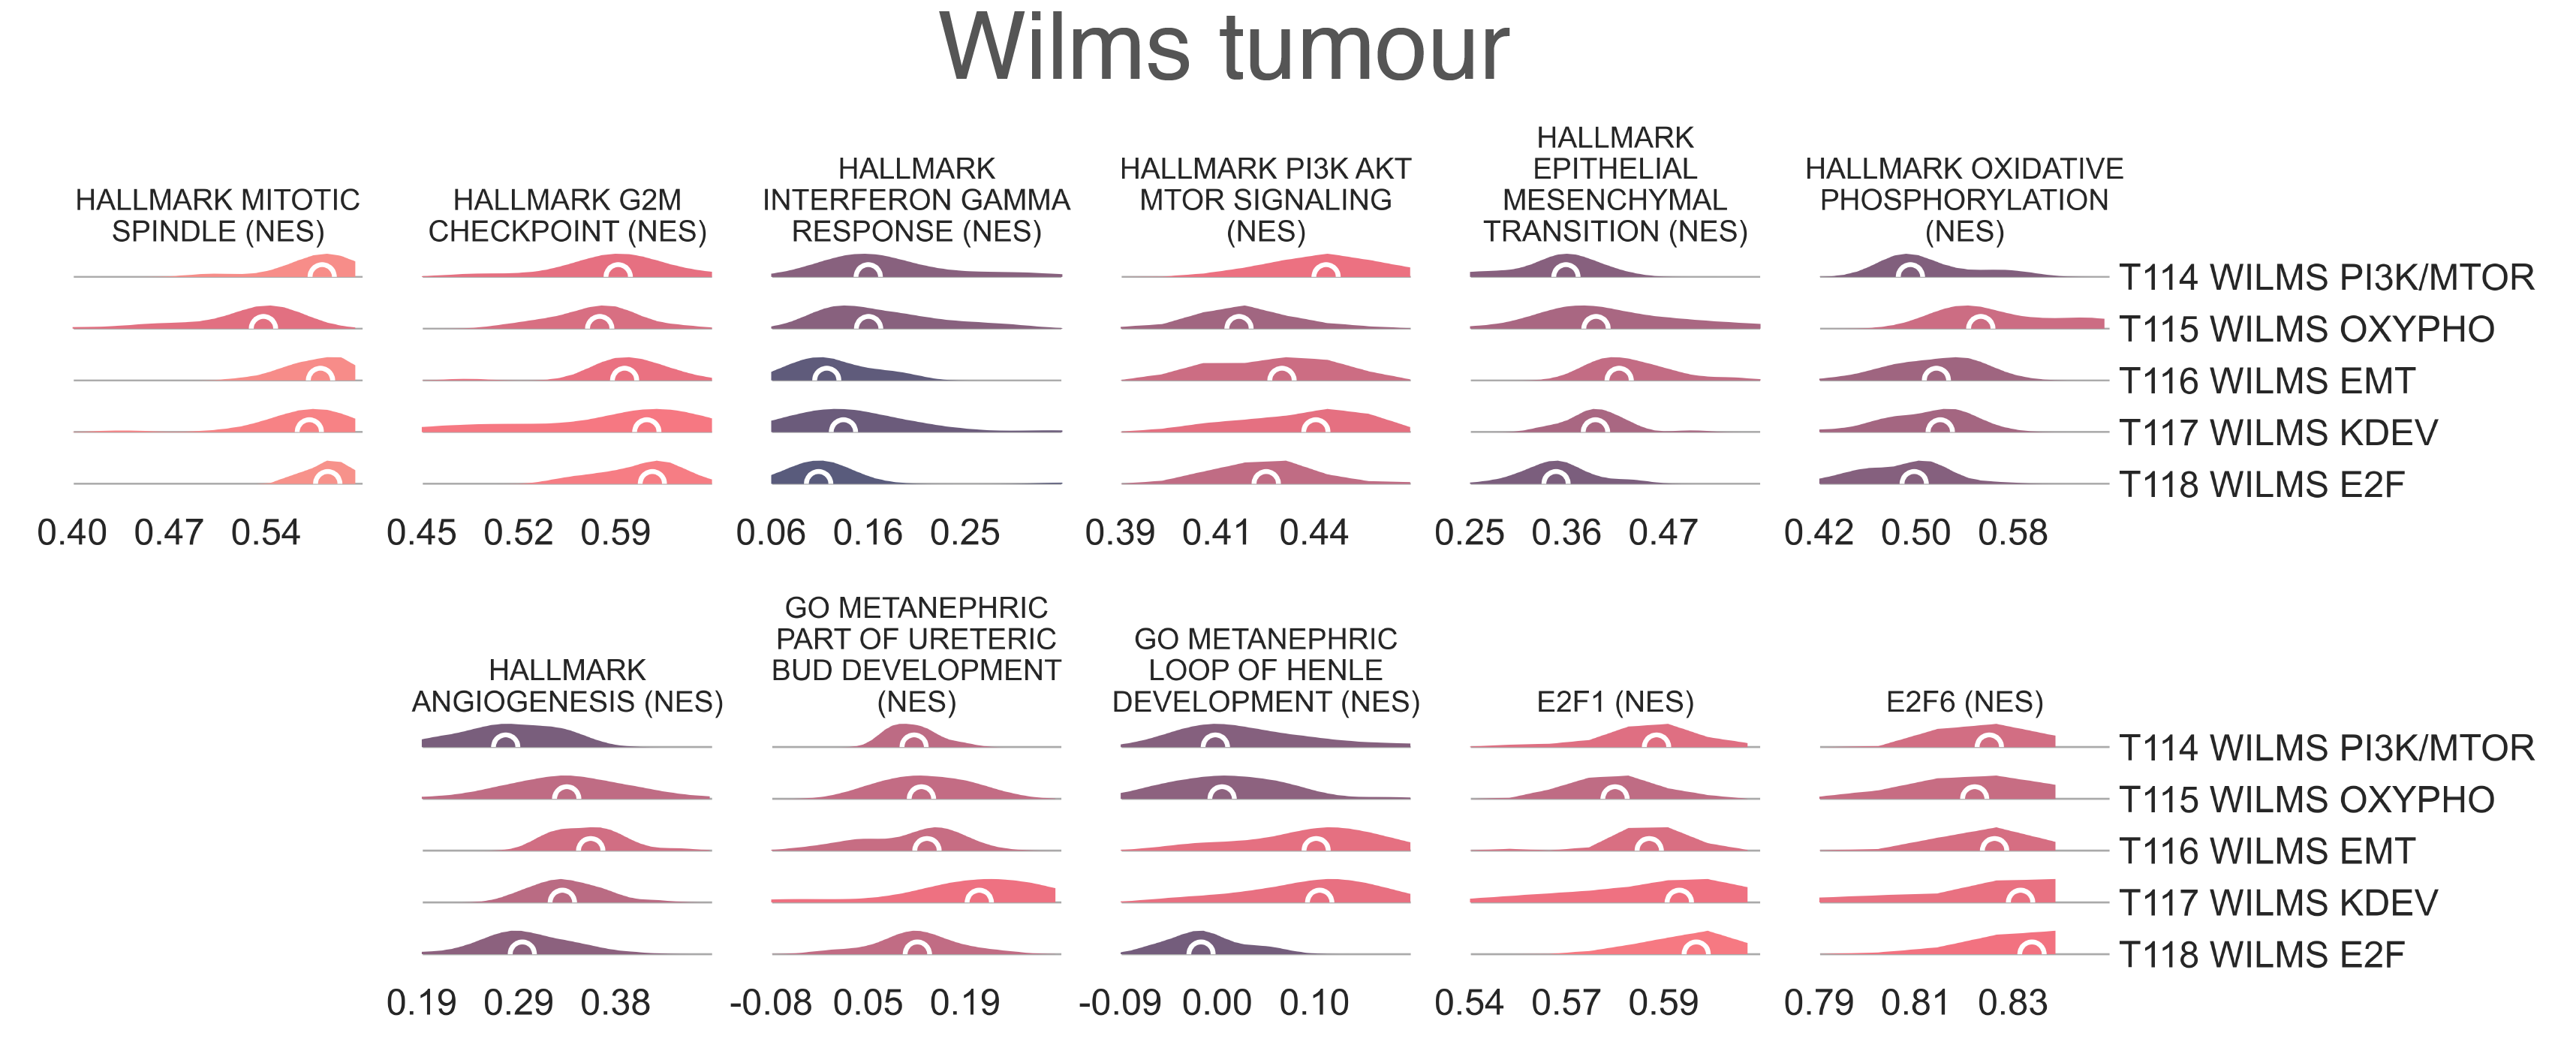
MESD13: Distribution plots of normalized enrichment score of gene sets relevant to the definition of Wilms tumor subtypes.
Bibliography
- Alakus2015
Alakus, H., Yost, S.E., Woo, B., et al. 2015. BAP1 mutation is a frequent somatic event in peritoneal malignant mesothelioma. Journal of Translational Medicine 13, p. 122.
- An2017
An, Y., Wang, H., Jie, J., et al. 2017. Identification of distinct molecular subtypes of uterine carcinosarcoma. Oncotarget 8(9), pp. 15878–15886.
- Anderson2021
Anderson, N.D., Babichev, Y., Fuligni, F., et al. 2021. Lineage-defined leiomyosarcoma subtypes emerge years before diagnosis and determine patient survival. Nature Communications 12(1), p. 4496.
- Ashburner2000(1,2,3,4,5,6,7,8,9)
Ashburner, M., Ball, C.A., Blake, J.A., et al. 2000. Gene Ontology: tool for the unification of biology. Nature Genetics 25(1), pp. 25–29.
- Barr2002
Barr, F.G., Qualman, S.J., Macris, M.H., et al. 2002. Genetic heterogeneity in the alveolar rhabdomyosarcoma subset without typical gene fusions. Cancer Research 62(16), pp. 4704–4710.
- Carregaro2013
Carregaro, F., Stefanini, A.C.B., Henrique, T. and Tajara, E.H. 2013. Study of small proline-rich proteins (SPRRs) in health and disease: a review of the literature. Archives of Dermatological Research 305(10), pp. 857–866.
- Conner2013
Conner, J.R. and Hornick, J.L. 2013. SATB2 is a novel marker of osteoblastic differentiation in bone and soft tissue tumors. Histopathology 63(1), pp. 36–49.
- Costa2019
Costa, A.D.A. and Gutmann, D.H. 2019. Brain tumors in Neurofibromatosis type 1. Neuro-Oncology Advances 1(1), p. vdz040.
- Cherniack2017(1,2)
Cherniack AD, Shen H, Walter V, Stewart C, Murray BA, Bowlby R, et al. Integrated molecular characterization of uterine carcinosarcoma. Cancer Cell. 2017 Mar 13;31(3):411–23.
- Davicioni2009(1,2,3,4)
Davicioni, E., Anderson, M.J., Finckenstein, F.G., et al. 2009. Molecular classification of rhabdomyosarcoma–genotypic and phenotypic determinants of diagnosis: a report from the Children’s Oncology Group. The American Journal of Pathology 174(2), pp. 550–564.
- Deyrup2007
Deyrup, A.T. and Montag, A.G. 2007. Epithelioid and Epithelial Neoplasms of Bone. Archives of Pathology & Laboratory Medicine.
- ENCODE2012
ENCODE Project Consortium 2012. An integrated encyclopedia of DNA elements in the human genome. Nature 489(7414), pp. 57–74.
- Gadd2017(1,2,3,4,5,6,7,8)
Gadd, S., Huff, V., Walz, A.L., et al. 2017. A Children’s Oncology Group and TARGET initiative exploring the genetic landscape of Wilms tumor. Nature Genetics 49(10), pp. 1487–1494.
- Gerhart2019
Gerhart, J., Behling, K., Paessler, M., et al. 2019. Rhabdomyosarcoma and Wilms tumors contain a subpopulation of noggin producing, myogenic cells immunoreactive for lens beaded filament proteins. Plos One 14(4), p. e0214758.
- Gjerstorff2015
Gjerstorff, M.F., Andersen, M.H. and Ditzel, H.J. 2015. Oncogenic cancer/testis antigens: prime candidates for immunotherapy. Oncotarget 6(18), pp. 15772–15787.
- Gryder2017
Gryder, B.E., Yohe, M.E., Chou, H.-C., et al. 2017. PAX3-FOXO1 Establishes Myogenic Super Enhancers and Confers BET Bromodomain Vulnerability. Cancer discovery 7(8), pp. 884–899.
- Hirota1998
Hirota, S., Isozaki, K., Moriyama, Y., et al. 1998. Gain-of-function mutations of c-kit in human gastrointestinal stromal tumors. Science 279(5350), pp. 577–580.
- Hmeljak2018
Hmeljak, J., Sanchez-Vega, F., Hoadley, K.A., et al. 2018. Integrative molecular characterization of malignant pleural mesothelioma. Cancer discovery 8(12), pp. 1548–1565.
- Hu2016
Hu, K., Dai, H.-B. and Qiu, Z.-L. 2016. mTOR signaling in osteosarcoma: Oncogenesis and therapeutic aspects (Review). Oncology Reports 36(3), pp. 1219–1225.
- Kawai1998
Kawai, A., Huvos, A.G., Meyers, P.A. and Healey, J.H. 1998. Osteosarcoma of the pelvis. Oncologic results of 40 patients. Clinical Orthopaedics and Related Research (348), pp. 196–207.
- Kim2020
Kim, Y.-S., Shin, S., Jung, S.-H. and Chung, Y.-J. 2020. Pathogenic NF1 truncating mutation and copy number alterations in a dedifferentiated liposarcoma with multiple lung metastasis: a case report. BMC Medical Genetics 21(1), p. 200.
- Kiuru2017
Kiuru, M. and Busam, K.J. 2017. The NF1 gene in tumor syndromes and melanoma. Laboratory Investigation 97(2), pp. 146–157.
- Kohsaka2014
Kohsaka, S., Shukla, N., Ameur, N., et al. 2014. A recurrent neomorphic mutation in MYOD1 defines a clinically aggressive subset of embryonal rhabdomyosarcoma associated with PI3K-AKT pathway mutations. Nature Genetics 46(6), pp. 595–600.
- Korkola2006
Korkola, J.E., Houldsworth, J., Chadalavada, R.S.V., et al. 2006. Down-regulation of stem cell genes, including those in a 200-kb gene cluster at 12p13.31, is associated with in vivo differentiation of human male germ cell tumors. Cancer Research 66(2), pp. 820–827.
- Korkola2005
Korkola, J.E., Houldsworth, J., Dobrzynski, D., et al. 2005. Gene expression-based classification of nonseminomatous male germ cell tumors. Oncogene 24(32), pp. 5101–5107.
- Kossler2011
Kossler, N., Stricker, S., Rödelsperger, C., et al. 2011. Neurofibromin (Nf1) is required for skeletal muscle development. Human Molecular Genetics 20(14), pp. 2697–2709.
- Li2002
Li, C.-M., Guo, M., Borczuk, A., et al. 2002. Gene expression in Wilms’ tumor mimics the earliest committed stage in the metanephric mesenchymal-epithelial transition. The American Journal of Pathology 160(6), pp. 2181–2190.
- Liberzon2015(1,2,3,4,5,6)
Liberzon, A., Birger, C., Thorvaldsdóttir, H., Ghandi, M., Mesirov, J.P. and Tamayo, P. 2015. The Molecular Signatures Database (MSigDB) hallmark gene set collection. Cell Systems 1(6), pp. 417–425.
- Makise2017
Makise, N., Yoshida, A., Komiyama, M., et al. 2017. Dedifferentiated liposarcoma with epithelioid/epithelial features. The American Journal of Surgical Pathology 41(11), pp. 1523–1531.
- Mehrain2013
Mehrain, R. and Nabahati, M. 2013. A case of rhabdomyosarcoma of kidney mimicking nephroblastoma. Caspian journal of internal medicine 4(1), pp. 621–623.
- Newman2015
Newman, A.M., Liu, C.L., Green, M.R., et al. 2015. Robust enumeration of cell subsets from tissue expression profiles. Nature Methods 12(5), pp. 453–457.
- Parham2013
Parham, D.M. and Barr, F.G. 2013. Classification of rhabdomyosarcoma and its molecular basis. Advances in Anatomic Pathology 20(6), pp. 387–397.
- Pemov2020
Pemov, A., Li, H., Presley, W., Wallace, M.R. and Miller, D.T. 2020. Genetics of human malignant peripheral nerve sheath tumors. Neuro-Oncology Advances 2(Suppl 1), pp. i50–i61.
- Pulford2017
Pulford, E., Huilgol, K., Moffat, D., Henderson, D.W. and Klebe, S. 2017. Malignant mesothelioma, BAP1 immunohistochemistry, and VEGFA: does BAP1 have potential for early diagnosis and assessment of prognosis? Disease markers 2017, p. 1310478.
- Quesada2012
Quesada, J. and Amato, R. 2012. The molecular biology of soft-tissue sarcomas and current trends in therapy. Sarcoma 2012, p. 849456.
- Saab2005
Saab, R., Rao, B.N., Rodriguez-Galindo, C., Billups, C.A., Fortenberry, T.N. and Daw, N.C. 2005. Osteosarcoma of the pelvis in children and young adults: the St. Jude Children’s Research Hospital experience. Cancer 103(7), pp. 1468–1474.
- Samkari2018
Samkari, A. and Al-Maghrabi, H. 2018. Rhabdomyosarcoma of the kidney. Journal of Pediatric Surgery Case Reports 32, pp. 62–67.
- Schaefer2009(1,2)
Schaefer, C.F., Anthony, K., Krupa, S., et al. 2009. PID: the pathway interaction database. Nucleic Acids Research 37(Database issue), pp. D674-9.
- Shen2018
Shen, H., Shih, J., Hollern, D.P., et al. 2018. Integrated molecular characterization of testicular germ cell tumors. Cell reports 23(11), pp. 3392–3406.
- Smith2015
Smith, S.C., Buehler, D., Choi, E.-Y.K., et al. 2015. CIC-DUX sarcomas demonstrate frequent MYC amplification and ETS-family transcription factor expression. Modern Pathology 28(1), pp. 57–68.
- Smithey2002
Smithey, B.E., Pappo, A.S. and Hill, D.A. 2002. C-kit expression in pediatric solid tumors: a comparative immunohistochemical study. The American Journal of Surgical Pathology 26(4), pp. 486–492.
- Specht2014
Specht, K., Sung, Y.-S., Zhang, L., Richter, G.H.S., Fletcher, C.D. and Antonescu, C.R. 2014. Distinct transcriptional signature and immunoprofile of CIC-DUX4 fusion-positive round cell tumors compared to EWSR1-rearranged Ewing sarcomas: further evidence toward distinct pathologic entities. Genes, Chromosomes & Cancer 53(7), pp. 622–633.
- TCGA2017(1,2,3,4,5)
The Cancer Genome Atlas Research Network 2017. Comprehensive and integrated genomic characterization of adult soft tissue sarcomas. Cell 171(4), p. 950–965.e28.
- TGOC2019(1,2,3,4,5,6,7,8,9)
The Gene Ontology Consortium 2019. The Gene Ontology Resource: 20 years and still GOing strong. Nucleic Acids Research 47(D1), pp. D330–D338.
- Thorsson2018
Thorsson, V., Gibbs, D.L., Brown, S.D., et al. 2018. The immune landscape of cancer. Immunity 48(4), p. 812–830.e14.
- Thway2016
Thway, K., Jones, R.L., Noujaim, J. and Fisher, C. 2016. Epithelioid sarcoma: diagnostic features and genetics. Advances in Anatomic Pathology 23(1), pp. 41–49.
- Williamson2010
Williamson, D., Missiaglia, E., de Reyniès, A., et al. 2010. Fusion gene-negative alveolar rhabdomyosarcoma is clinically and molecularly indistinguishable from embryonal rhabdomyosarcoma. Journal of Clinical Oncology 28(13), pp. 2151–2158.
- Yang2018
Yang, L., Forker, L., Irlam, J.J., Pillay, N., Choudhury, A. and West, C.M.L. 2018. Validation of a hypoxia related gene signature in multiple soft tissue sarcoma cohorts. Oncotarget 9(3), pp. 3946–3955.
- Yoshimoto2017
Yoshimoto, T., Tanaka, M., Homme, M., et al. 2017. CIC-DUX4 Induces Small Round Cell Sarcomas Distinct from Ewing Sarcoma. Cancer Research 77(11), pp. 2927–2937.
- Zou2012(1,2)
Zou, C., Shen, J., Tang, Q., et al. 2012. Cancer-testis antigens expressed in osteosarcoma identified by gene microarray correlate with a poor patient prognosis. Cancer 118(7), pp. 1845–1855.