T000 Central Nervous System
Version: 0.1.0
Last change: May 07, 2022
The CNS tumors in our dataset exhibit three major divides: glioma vs. non-gliomas, gliomas with wildtype or mutated IDH1, and, in this last group, samples with and without hemizygous codeletion of chromosome arms 1p and 19q (Fig. CNS1). Past these major divides, differences in histotypes and tumor phenotype, as well as the transcriptional signals generated from specific mutations, become increasingly important to differentiate sibling classes.
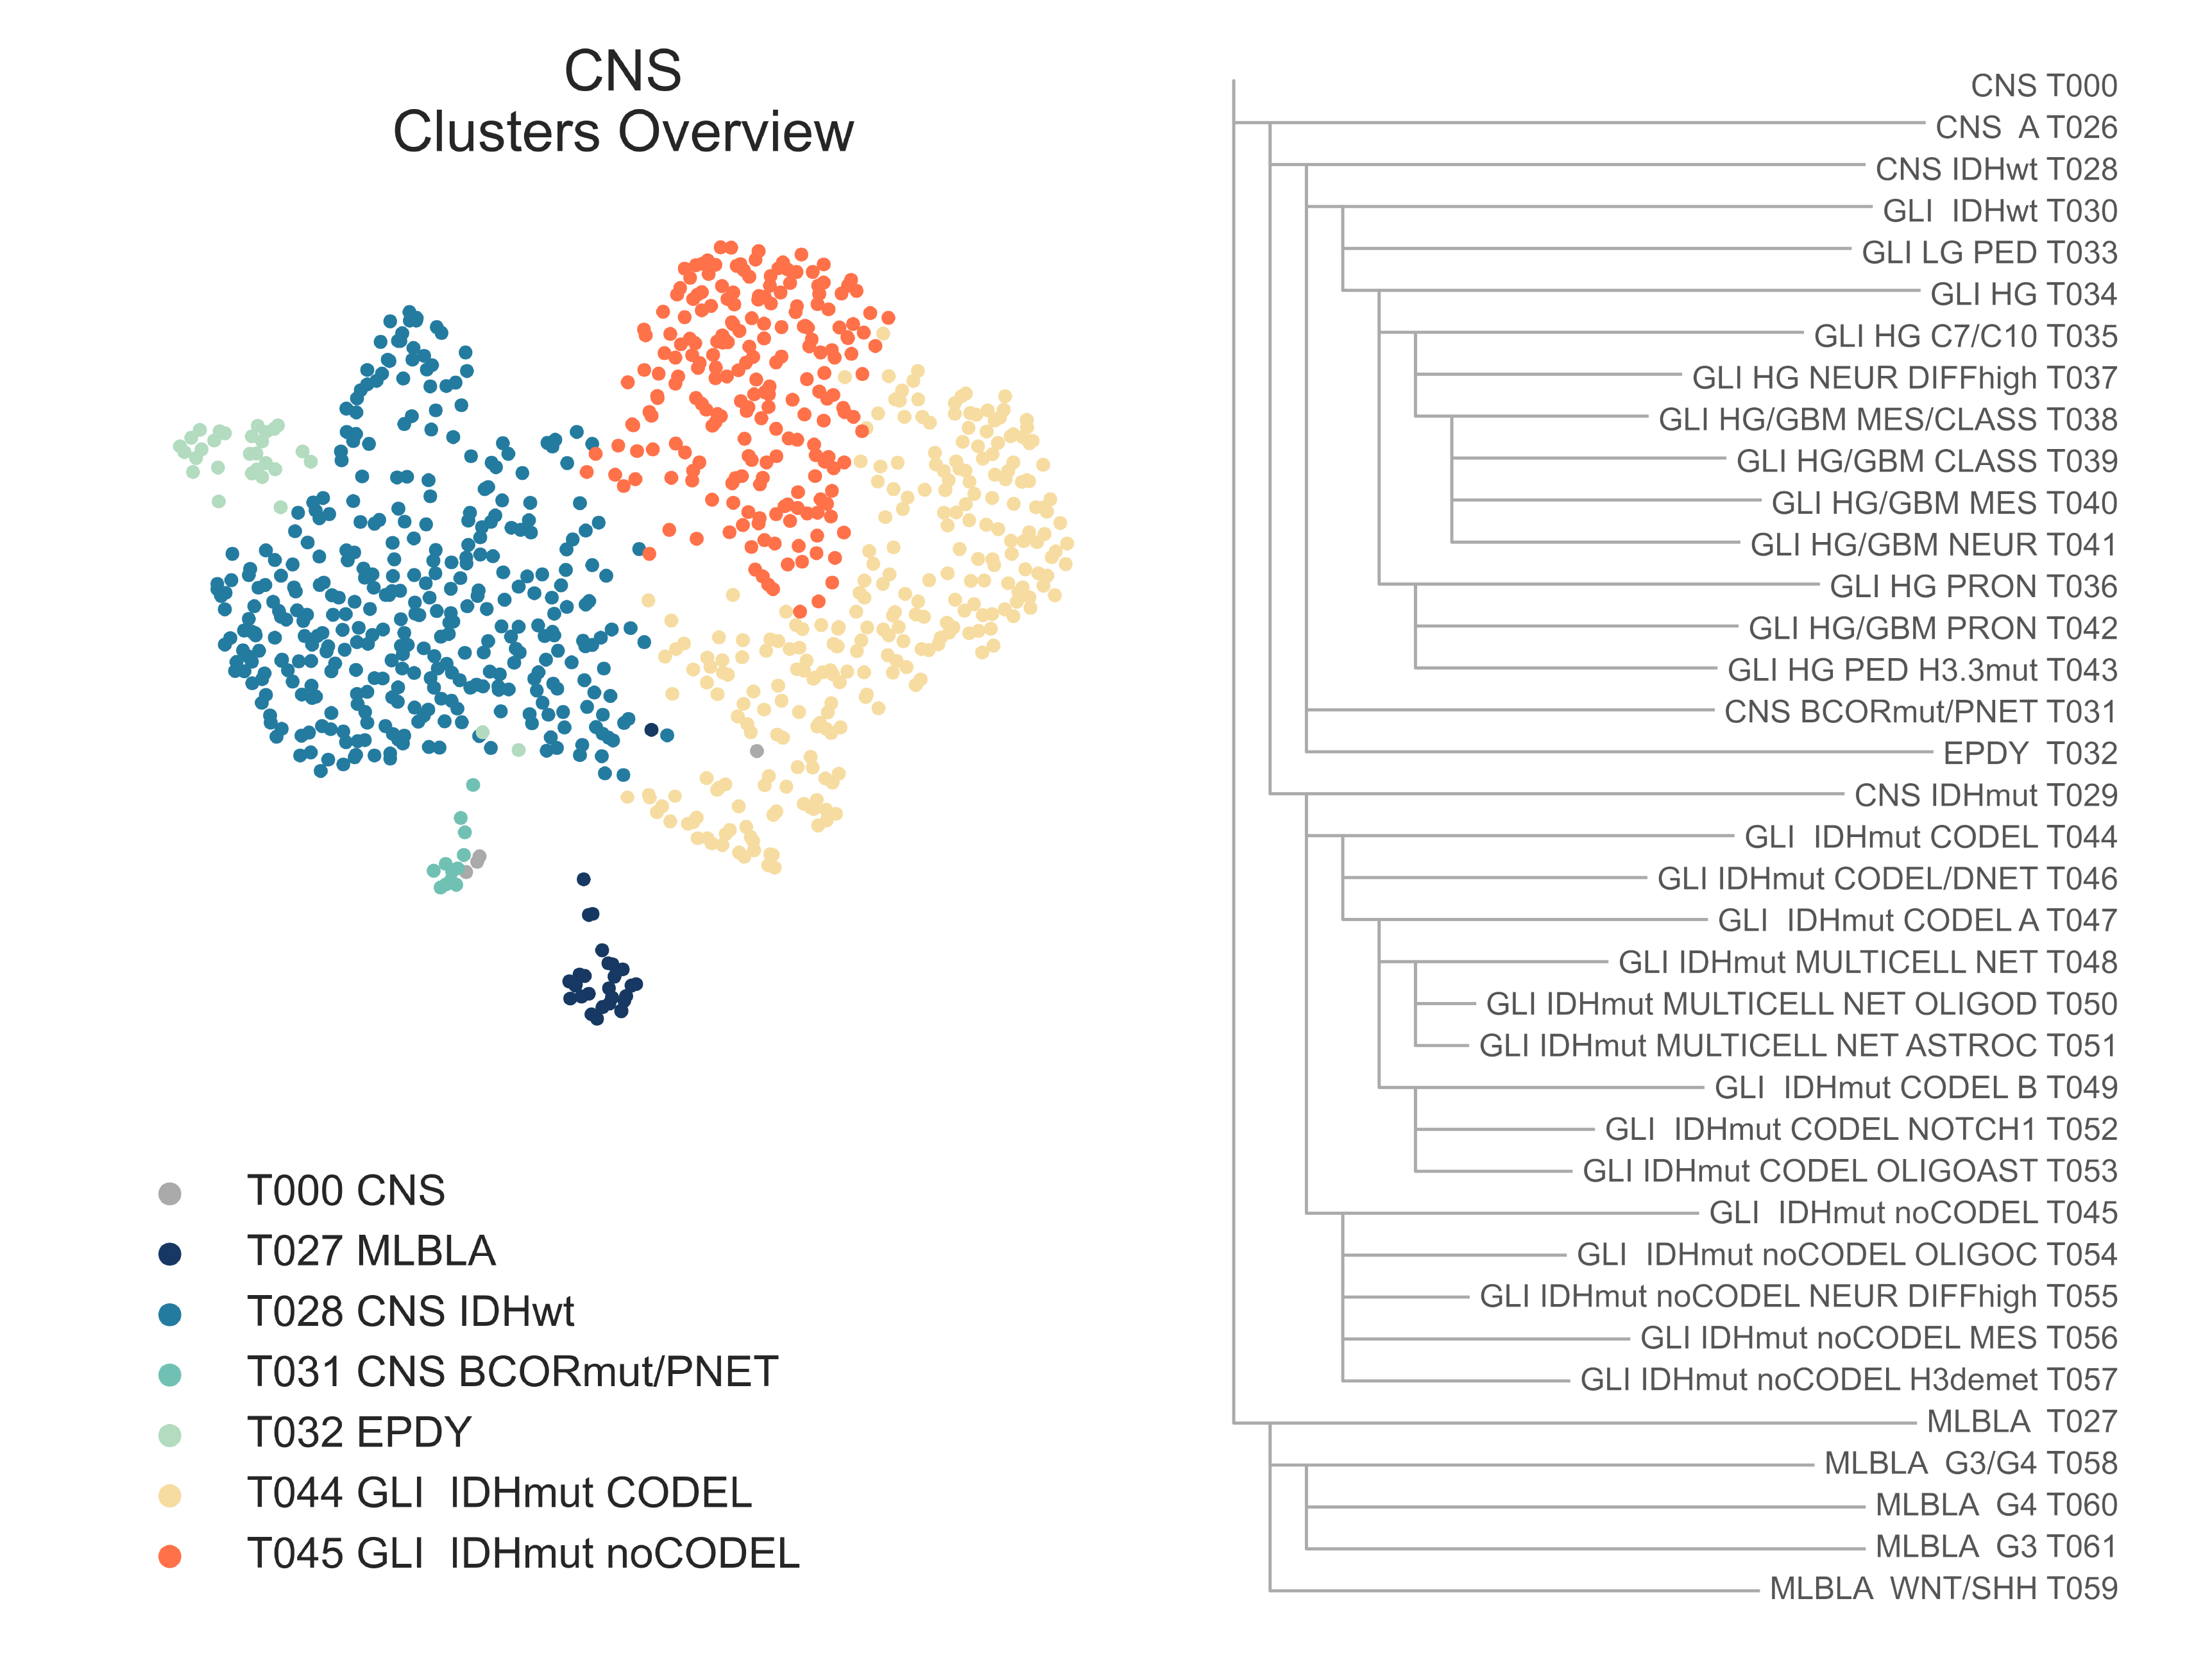
CNS1: On the left, a 2-dimensional UMAP projection of CNS tumors by gene expression, where several subtypes found in the first layers of the hierarchy are highlighted with different colors. On the right, a list of all CNS subtypes identified and their hierarchical relationship.
Medulloblastoma
At the first level, we see the separation of medulloblastomas, in T027 MLBLA (n = 29), from the rest of CNS tumors T026 CNS A (n = 894) (Fig. CNS1). Letters in the naming will be used in this setting to distinguish mixed classes that maintain the same composition of their parent class, with the removal of specific subtypes singled out into their sibling classes, as in this case. Interestingly, we also note the presence of a single pineal parenchymal tumor in T026. Multi-scale clustering allows us to observe the emergence of known subtypes from literature at deeper level of this branch [Northcott2012]. This class further splits into T058 MLBLA G3/G4 (n = 37) (Fig. CNS1), a cluster of mixed G3 and G4 subtypes, with overexpression of OTX2 (glmQLFTest logFC = 3.48, FDR = 6.368e-06) and FOXG1 (logFC = 8.44, FDR = 4.026e-06), while T059 MLBLA WNT/SSH (n = 5), shows overexpression of both WNT (ssGSEA [Hänzelmann2013], medNES = 1.15, MWU adj. p-val = 6.74e-05) and SHH (medNES = 1.42, MWU adj. p-val = 2.02e-04) pathways [Kanehisa2000]. While samples of the G3 and G4 subtypes are then separated at the next level into T060 MLBLA G4 (n = 9) and T061 MLBLA G3 (n = 15), the population of T059 is well below our set cut-off, preventing RACCOON from dividing WNT and SHH subtypes. T060 overexpresses genes of the G4 subtype, including SNCAIP (logFC = 5.68, FDR = 1.11e-05), DIRAS3 (logFC = 4.35, FDR = 2.351e-06), KCNA1 (logFC = 4.19, FDR = 3.684e-04), and RND1 (logFC = 3.26, FDR = 1.542e-04), while T061 overexpresses genes upregulated in the G3 subtype, such as PDE6H (logFC = -6, FDR = 6.038e-04), GNGT1 (logFC = -6.1, FDR = 2.651e-04), and NPR3 (logFC = -5.71, FDR = 4.824e-04).
Separation by IDH1 status
Following the remainder of CNS tumors after the removal of medulloblastomas, we observe the separation of gliomas without IDH1 mutations, which form T028 CNS IDHwt (n = 406) from samples with IDH1 mutations (19/222 vs 417/433, χ2 p-val < 2.2e-16), which form T029 CNS IDHmut (n = 488) (Fig. CNS1). The latter has patients with lower median age (49.00 vs 38.00 y.o., MWU p-val = 2.04e-3), but T028 has a considerably higher proportion of pediatric patients (40.06% vs. 27.05%, χ2 p-val = 2.40e-05). Furthermore, T028 displays patients with significantly worse survival (lrt p-val (Kaplan-Meier log rank test p-value)` = 1.57e-50 at 6423 days) in line with literature [Hartmann2010] reaching median overall survival (OS) at only 448 days compared to T029 at 2907 (Fig. CNS2) [Park2016], [Steponaitis2016], [Cimino2018], [Hernández2010].
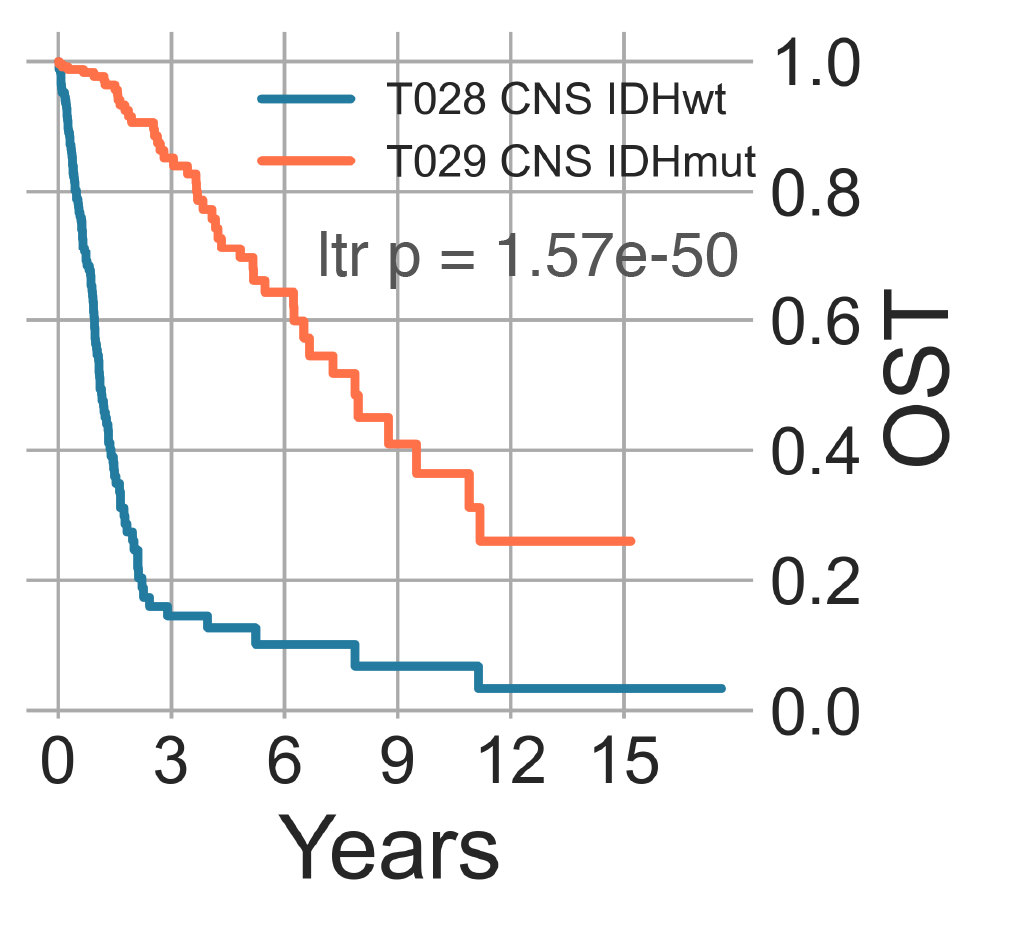
CNS2: Overall survival time curves of wild-type and mutant IDH tumors.
BCOR-altered Samples and Ependymoma
Along the IDH1 wild-type branch T028 we then observe the separation of gliomas and glioblastomas in T030 GLI IDHwt from ependymomas in T032 EPDY and samples with lesions of the BCL-6 corepressor protein gene, BCOR, T031 CNS BCOR/PNET (Fig. CNS1, Fig. CNS3a). T030 GLI IDHwt (n = 364) includes the vast majority of gliomas and glioblastomas without mutations of IDH1 and is the oldest class (median age = 52 y.o. KW p-val = 5.72e-10). T031 CNS BCOR/PNET is a peculiarly small cluster (n = 12) comprised of heterogeneous diagnoses. It includes a variety of brain and CNS tumors, including ependymomas, primitive neuroectodermal tumors (PNET), gliomas, an embryonal tumor with multi-layered rosettes, and a handful of solid tumors - several possibly misdiagnosed as Ewing sarcoma - and one infantile fibrosarcoma (Fig. 5d). All samples are from pediatric patients, with a median age of 4.5 y.o. This cluster is characterized by an overexpression of BCOR (medLogFC ≤ 2.94e-41) (Fig. CNS3c).
BCOR participates in a range of chromatin altering activities including binding to histone acetylases and chromatin-altering complexes, namely polycomb group complexe [Gearhart2006]. Alterations of these genes, many of which consist of fusions or internal tandem duplications (ITD) (Fig. CNS3b), have been well characterized in both soft tissue tumors and a recently defined group of CNS neoplasms: high-grade neuroepithelial tumors of the central nervous system (CNS HGNET-BCOR) [Sturm2016]. Gene set enrichment analyses revealed significant upregulation of both WNT (medNES median Normalized Enrichment Score) ≥ 1.35, KW adj. p-val = 3.83e-09, Dunn adj. p-val < 1.00e-04) [Liberzon2015] and SHH (medNES median Normalized Enrichment Score) ≥ 1.51, KW adj. p-val = 6.16e-09, Dunn adj. p-val < 1.00e-04) pathways [Nishimura2001], as well as basal cell carcinoma pathways (medNES median Normalized Enrichment Score) ≥ 1.70, KW adj. p-val = 2.84e-20, Dunn adj. p-val < 1.00e-04) [Kanehisa2000] in line with what is reported in literature. We also observe significant overexpression of NTRK3 (medLogFC = 2.45, FDR ≤ 1.7e-16), but not NTRK2 (FDR ≤ 5.847e-01) and NTRK1 (FDR ≤ 9.063e-01) in T031 vs. T030 and T032, as commonly described in BCOR-ITD sarcomas [Kao2018], [Kao2020]. Finally, T032 EPDY (n = 30) is comprised almost exclusively of ependymomas. It is the cluster with the youngest patients, with a median age of 2.64 y.o. No subtypes are identified, possibly due to the limits in the reference dataset population.
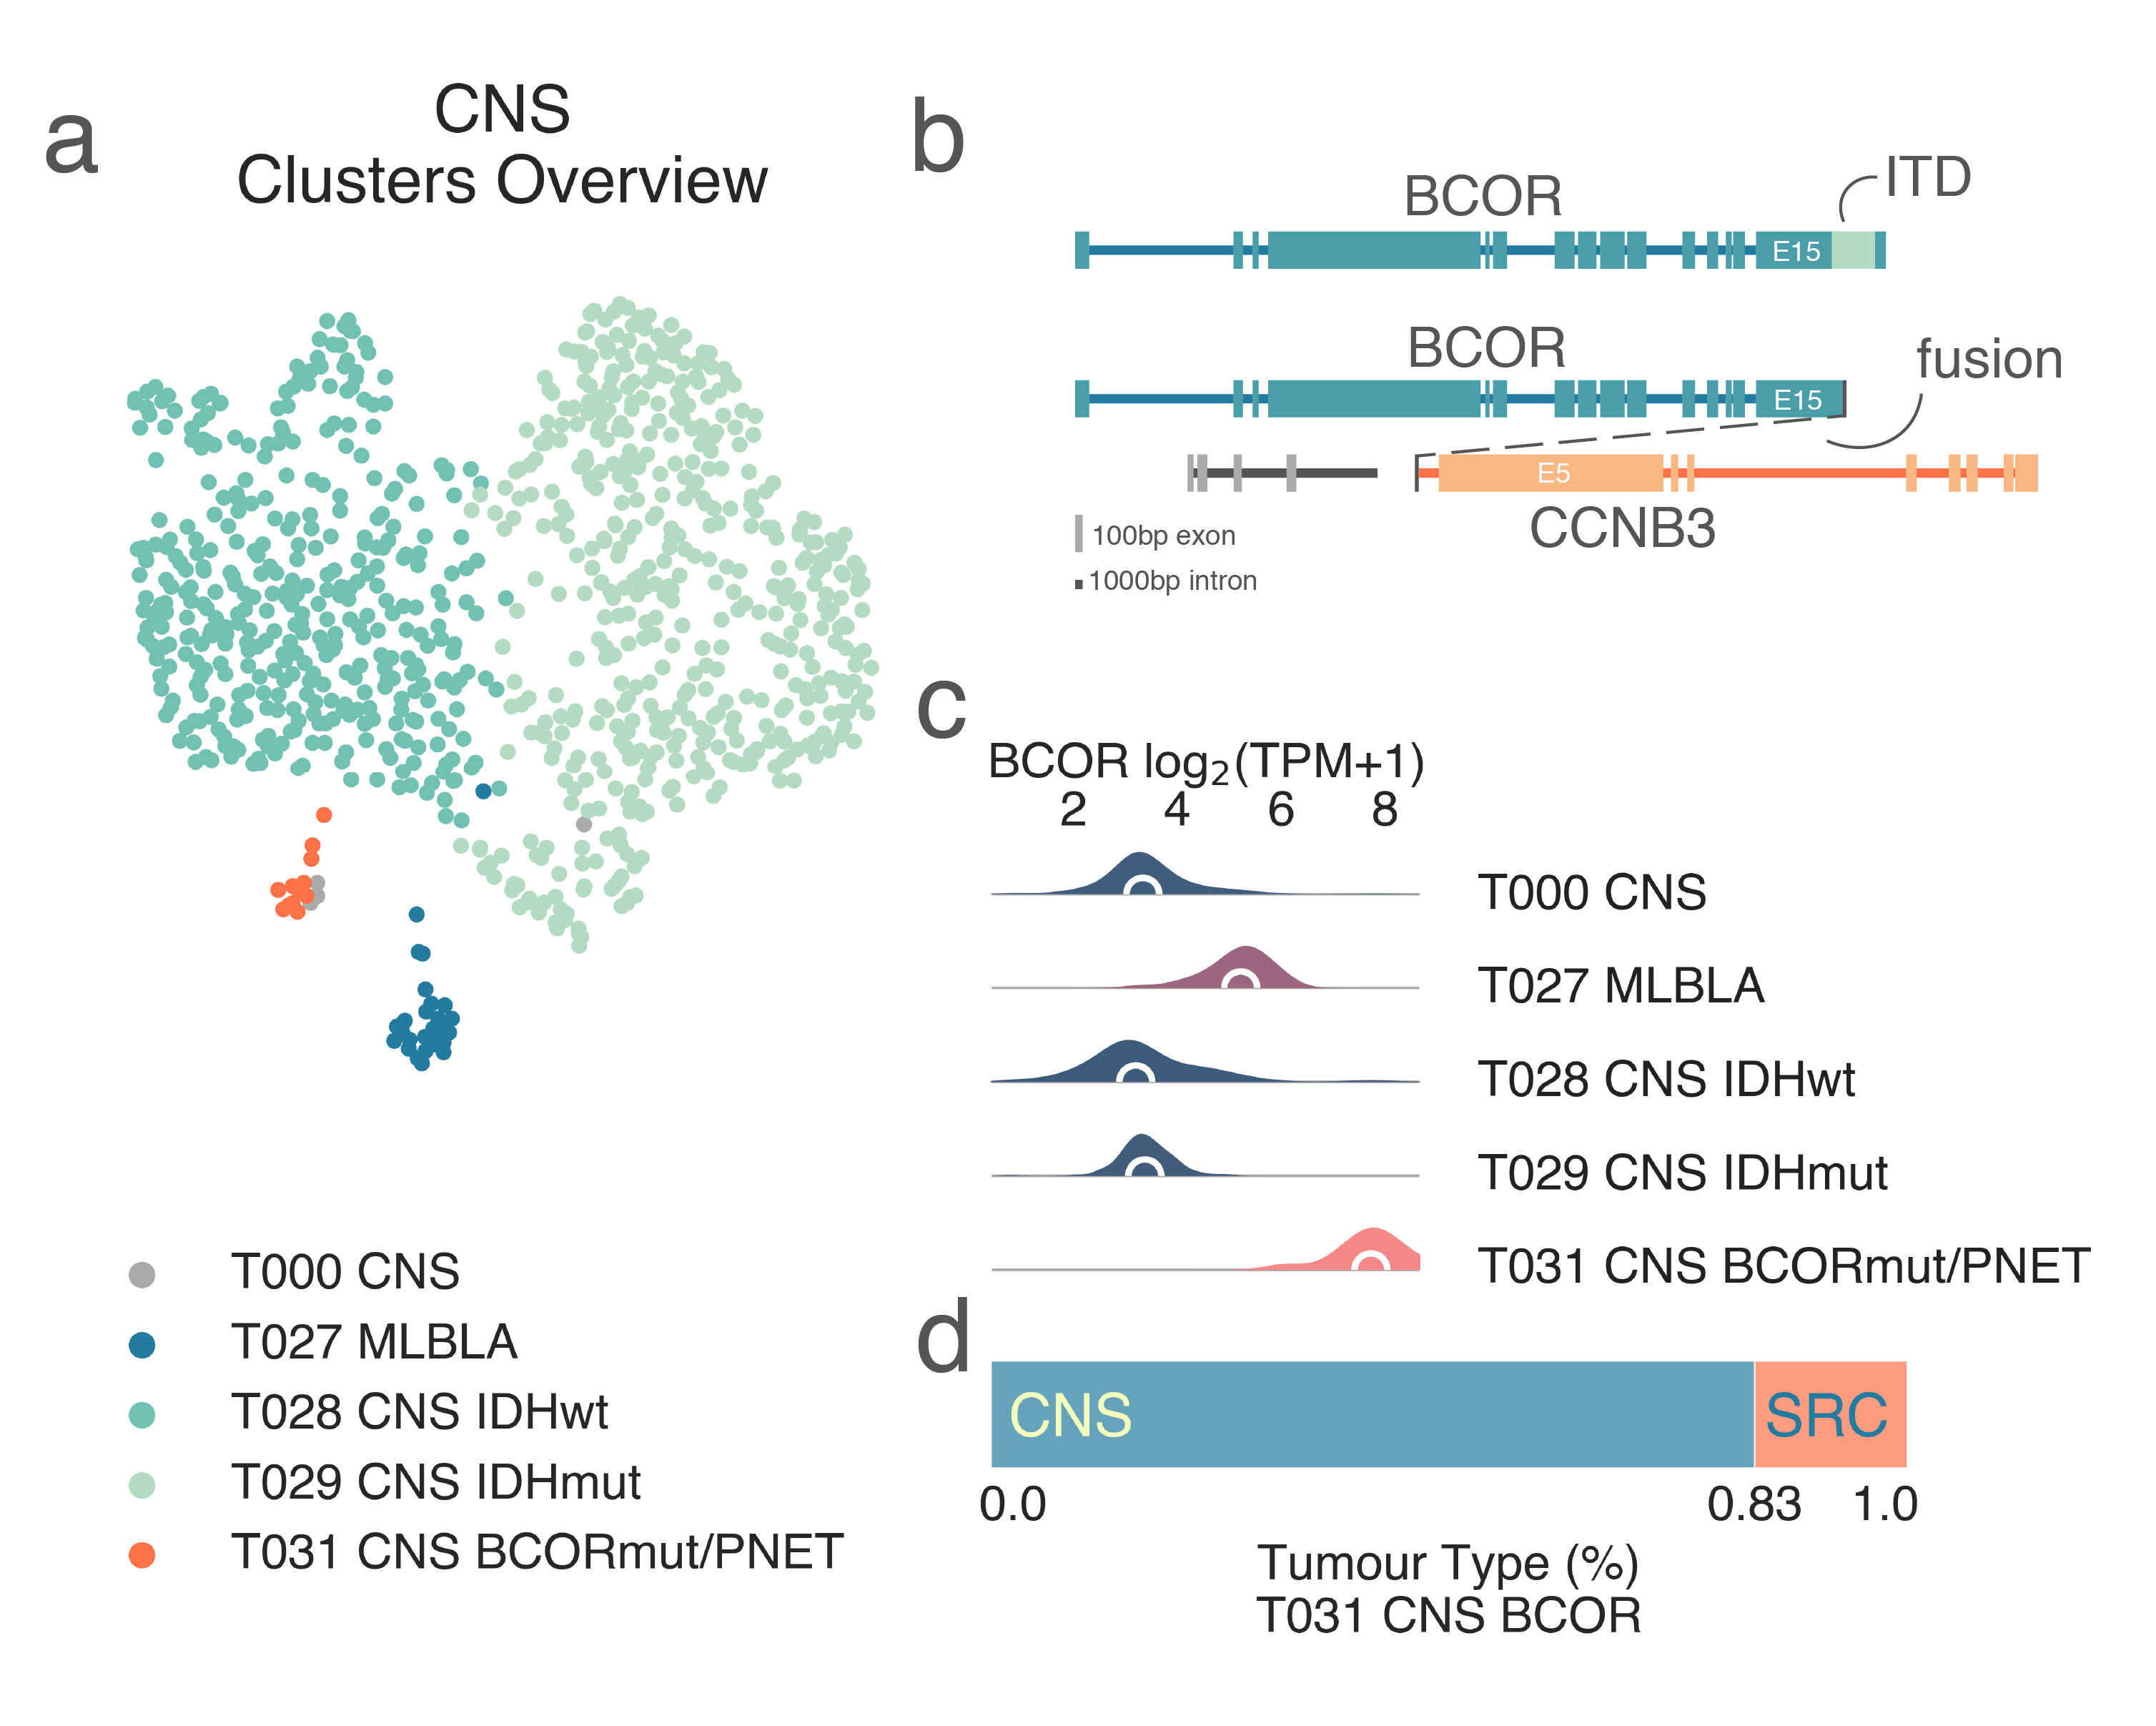
CNS3: Summary of the findings relating to BCOR-mutated and CIC-mutated tumors. A) 2-dimensional UMAP projection of CNS tumors by gene expression, where a few representative classes are shown with shades of blue and green. The BCOR-mutated class is highlighted in orange (T031). B) Diagram representing the archetypical BCOR-ITD and BCOR-CCNB3 rearrangements. C) BCOR expression distribution across representative CNS classes, showing a clear overexpression in BCOR-mutated samples (T031). D) The idiosyncratic transcriptional profile of BCOR mutations is sufficient to overcome the cell-of-origin attraction during the clustering process. The ratio of tumor types within T031, shows that while it is mostly composed of CNS tumors, sarcomas are also found in this class.
IDH wild-type glioma
At the next level, we observe the separation between a small pediatric cluster T033 GLI LG PED (n = 63) and a much larger adult class T034 GLI HG (n=301) (Fig. CNS1). Both contain mixed diagnoses but with a strong majority of samples labelled as gliomas. There’s a significant difference in age, with T033 having a population with a median age of only 9.00 y.o. versus T034 with 56.00 y.o. (MWU p-val = 4.00e-20). T034 is characterized by significant upregulation of HOX genes (36/39 FDR < 0.05), particularly HOXD9 (logFC = -5.03, FDR = 1.20e-23) and HOXA5 (logFC = -6.18, FDR = 2.40e-29) [Tabuse2011], [Cimino2018] which have been associated with cancer cell survival and proliferation in gliomas. Together with overexpression of VEGFA [Xu2017] (logFC = -1.04, FDR = 2.15e-05), a marker of poor survival, and glioma stemness genes TERT and EGFR (FDR ≤ 1.00e-28) [Beck2011], this profile suggests T034 to be a class of high-grade gliomas and glioblastoma multiforme, while T033 to be a largely pediatric, low-grade glioma class, though all samples from the TCGA are astrocytomas (6/6 vs 50/232, χ2 p-val = 6.74e-05). This is supported by T033 being enriched for grade II (3/6 vs 10/232, χ2 p-val = 7.73e-05) samples, with T034 being enriched for grade IV samples (0/6 vs 155/232, χ2 p-val = 3.11e-03). However, we are unable to confirm differences in survival due to a lack of clinical annotation of samples in T033.
The glioma subtypes run much deeper along complex hierarchical paths. At the next level, T034 splits into T035 GLI HG LOH c7/10 (n =236) and T036 GLI HG PRON (N = 65) (Fig. CNS4). Both are mixed glioma and glioblastoma groups. We also observe a significant difference in age (median 58.00 vs 35.00 y.o. MWU p-val = 8.76e-06) and pediatric composition (13.56% vs 50.77%, χ2 p-val = 3.27e-10). There is no difference in overall survival between the groups (lrt p-val = 8.23e-02 at 6423 days) [Ceccarelli2016]. T035 contains almost all samples of the classical (85/185 vs. 1/29, χ2 p-val = 3.527e-05) and mesenchymal (87/185 vs. 3/29, χ2 p-val = 4.343e-04) expression subtypes, while T036 is almost wholly composed of the proneural subtypes (2/185 vs. 24/29, χ2 p-val < 2.2e-16); although the majority of neural type samples are also found in T035, the difference is not significant (11/185 vs. 1/29, χ2 p-val = 0.9128) [Ceccarelli2016], [Brennan2013]. T035 shows significant overexpression of SAA1 (logFC = 4.84, FDR = 2.869e-16), MEOX2 (logFC = 4.79, FDR = 8.46e-22), CHI3L1 (logFC = 3.5, FDR = 6.93e-20), S100A4 (logFC = 2.04, FDR = 1.26e-18) and ANXA1 (logFC = 2.68, FDR = 1.18e-37), all associated with poor survival [Tachon2019], [Xu2017] ,and has a considerably higher leukocyte content than T036 (0.190 vs. 0.059, MWU p-val = 1.42e-08) [Thorsson2018]. In turn, T036 samples overexpress PDGFRA (logFC = -2.8, FDR = 3.80e-34), a marker of the proneuronal expression type(Brennan2013). T035 contains more TP53 mutants (χ2 p-val =2.11-02), and is also enriched for genesets concerning loss of heterozygosity (LOH) of regions implicated in gliomagenesis (medNES = 1.32, MWU adj. p-val = 2.15e-06) [Roversi2006], suggesting it contains samples with gain of chromosome 7 and loss of chromosome 10. This is further supported by its overexpression of EGFR (logFC = 3.47, FDR = 1.18e-18) and is in line with literature, in which classical GBM samples tend to harbour these lesions. Indeed, T035 is highly enriched for tumors with gain chr7/loss chr10, confirmed by clinical data (139/200 vs. 15/35, χ2 p-val = 4.146e-03) [Ceccarelli2016]. T036 contains a greater proportion of ATRX-mutant tumors (9/194 vs. 10/24, χ2 p-val = 7.31e-06) [Ceccarelli2016].
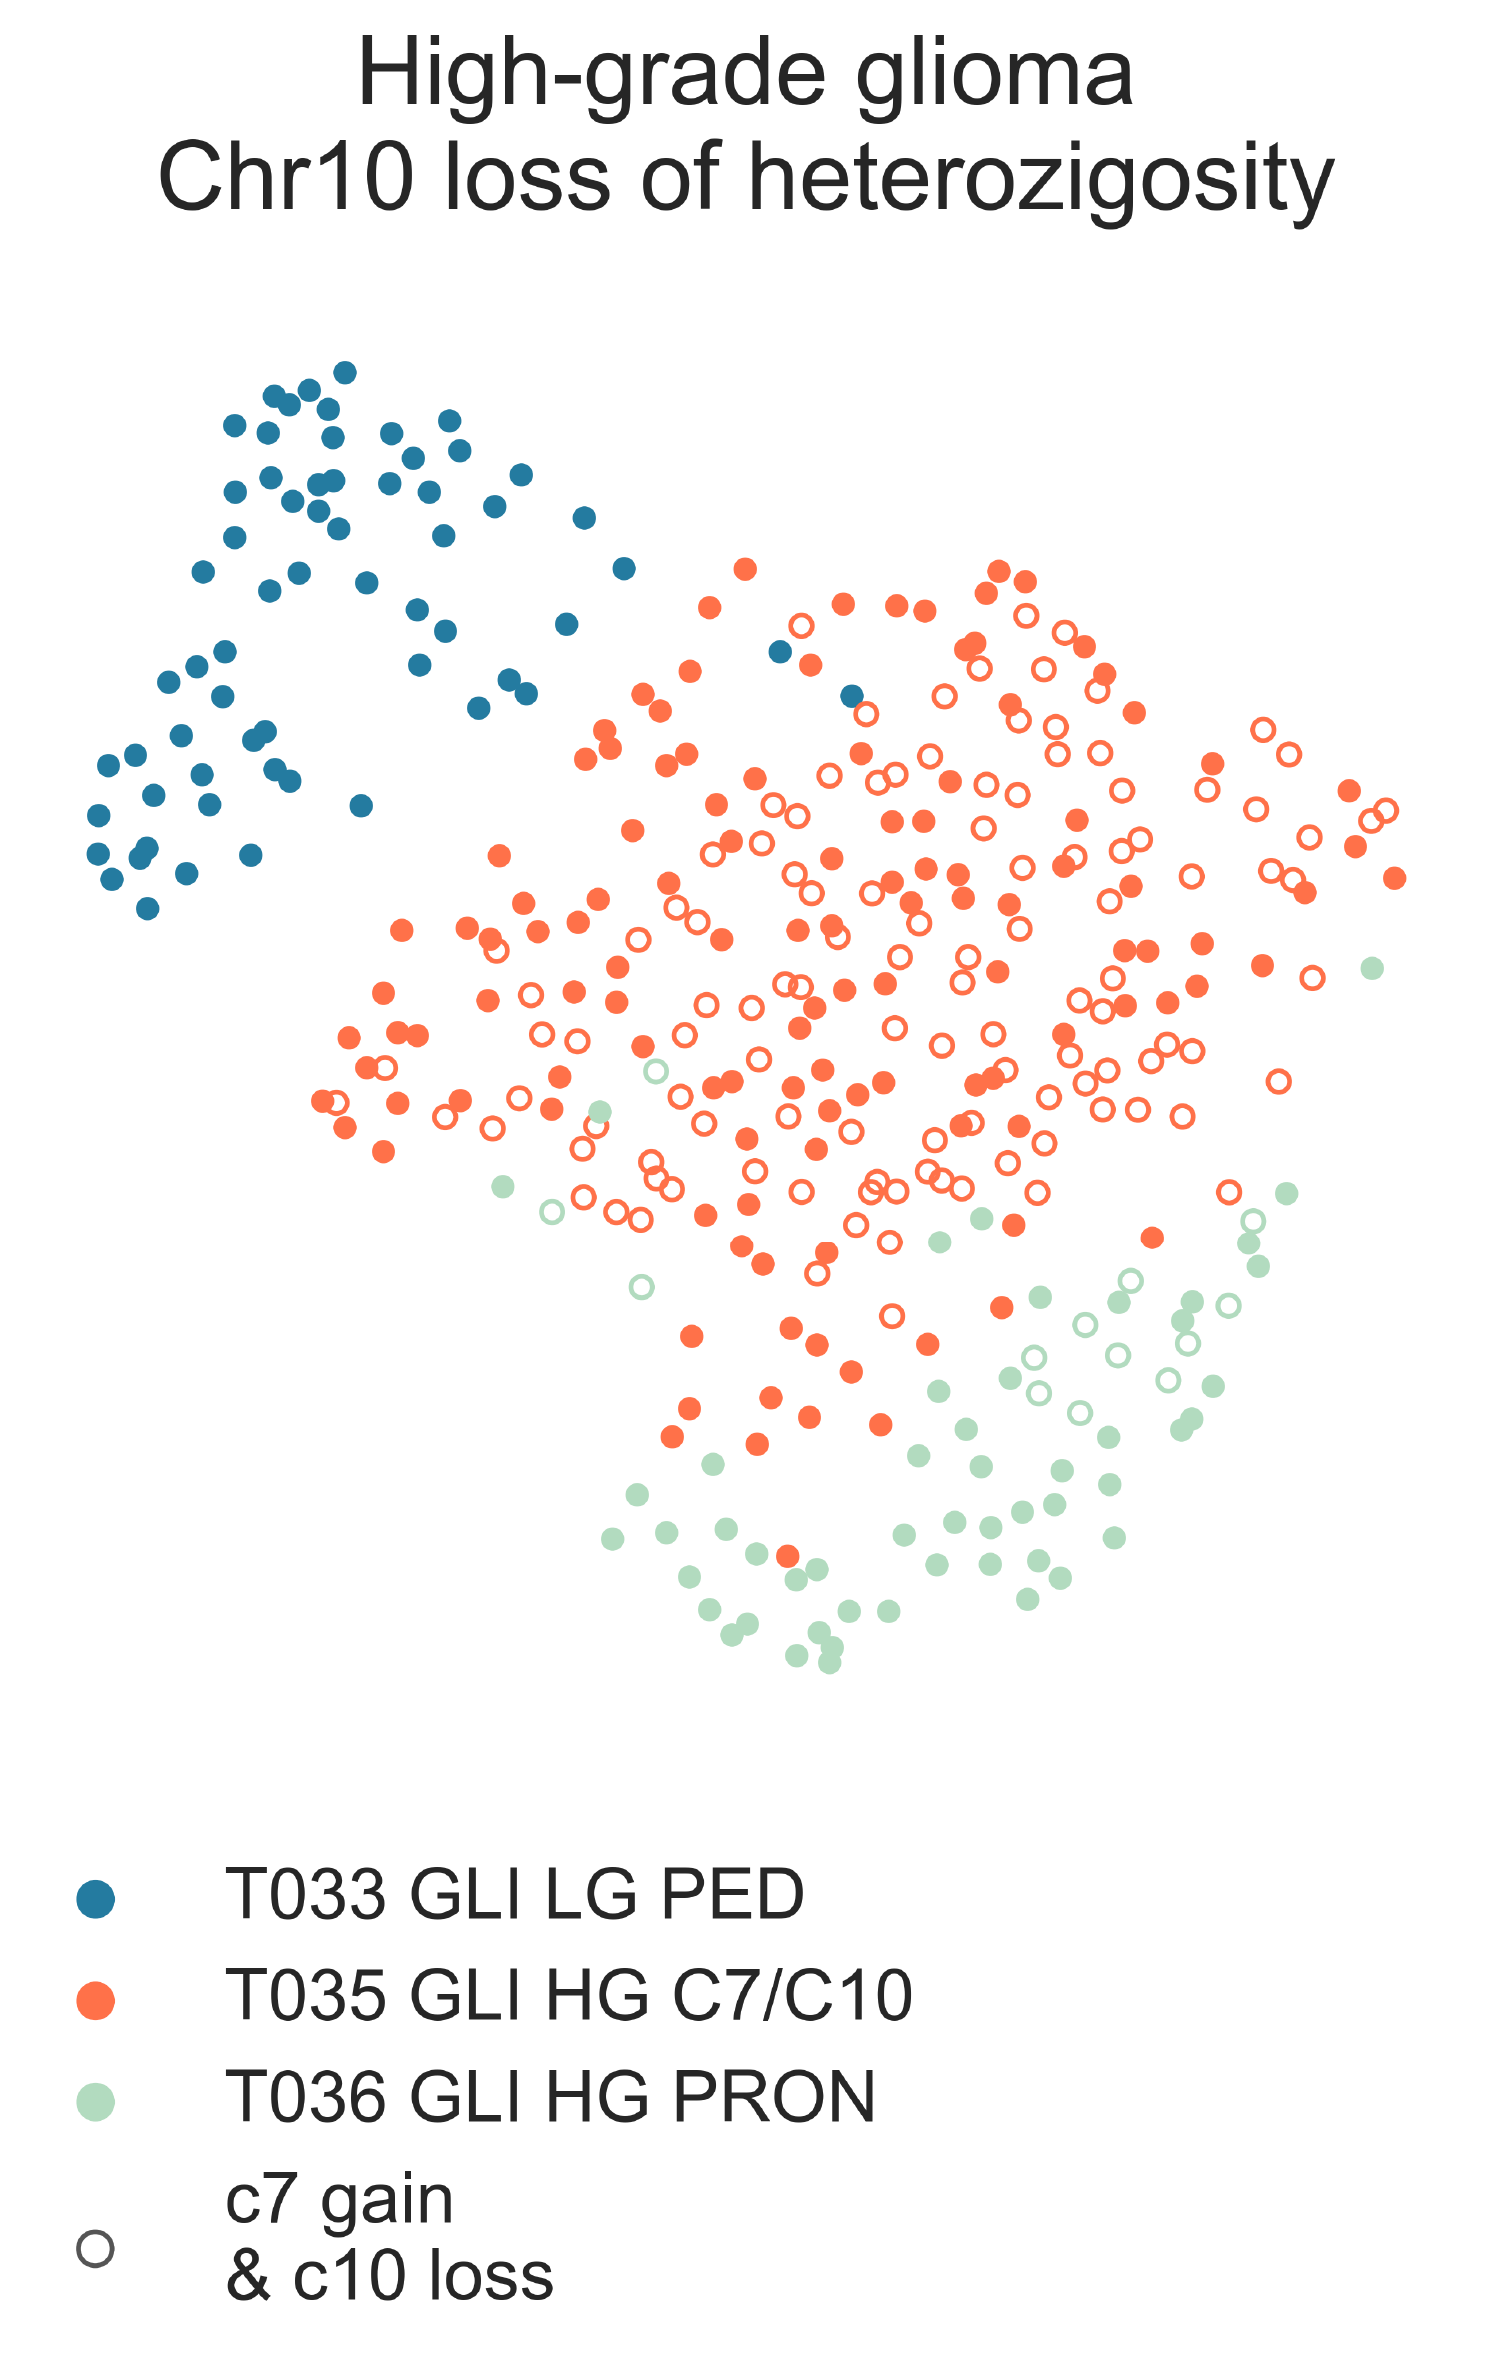
CNS4: 2-dimensional UMAP projection of subtypes of IDH-mutant gliomas. Samples with reported gain of chromosome 7 and loss of chromosome 10 are shown as empty circles.
Glioblastomas and high-grade gliomas separate at the next level within T036 (Fig. CNS1). We observe T042 GLI HG/GBM PRON (n = 48) carrying glioblastomas mostly of the proneuronal subtype and T043 GLI HG PED H3.3mut (n =19) with the rest of the samples, primarily marked as high-grade gliomas from St. Jude’s (χ2 p-val = 8.75e-14) (Fig. CNS1). The two classes also differ significantly in age, with T042 having patients with a median age of 44.5 y.o. while T043 has a median age of 5.85 y.o. (MWU p-val 3.88e-05). In fact, T043 is the cluster with the youngest group of patients within the entire cohort of both gliomas and gliobastomas and is one of only two clusters with >90% pediatric composition, the other being T033 GLI LG PED. Given that it’s a majority pediatric cluster whose parent cluster demonstrates very poor survival, T043 may represent H3.3 (H3F3A) mutated tumors. Support for this hypothesis comes from enrichment of gene sets involving H3.3 mutation (here nominally K27M) between T043 and T042 (medNES = 1.73, MWU adj. p-val = 3.39e-02) (Fig. CNS5) [Larson2019]. Notch signalling (medNES = 1.05, MWU adj. p-val = 2.31e-02) and neural differentiation (medNES = 1.04, MWU adj. p-val =6.10e-03) [Schaefer2009]. genesets are also enriched in T043 and are a feature of these tumors. [Paugh2011], [Chen2020] Going back up along the hierarchy, T035 GLI HG LOH c7/10 also splits in two (Fig. CNS1), with T037 GLI HG NEUR DIFFhigh (n = 93) being comprised of gliomas and glioblastomas of the classical (49/68 vs. 36/117, χ2 p-val = 1.29e-07) and neural subtypes (8/68 vs. 3/117, χ2 p-val = 2.58e-02) and T038 GLI HG/GBM MES/CLASS (n = 143) carrying a mixture of glioblastomas multiforme subtypes. T037 is composed of a majority of astrocytomas (34/78 vs. 10/118), χ2 p-val = 3.13e-08) while T038 contains a majority of glioblastomas (31/78 vs. 100/118, χ2 p-val = 9.30e-11). Interestingly, while almost all of the gliomas in T038 are marked as IDH1 wild type, a handful of samples are IDH1-mutant (0/84 vs. 10/114, χ2 p-val = 1.40e-2), suggesting these may be passenger rather than driver mutations. T038 also has significantly higher leukocyte fraction (0.178 vs. 0.248, MWU p-val = 1.77e-02). There are no differences in proportion of gain chr7/loss chr10 samples (χ2 p-val = 3.80e-01).
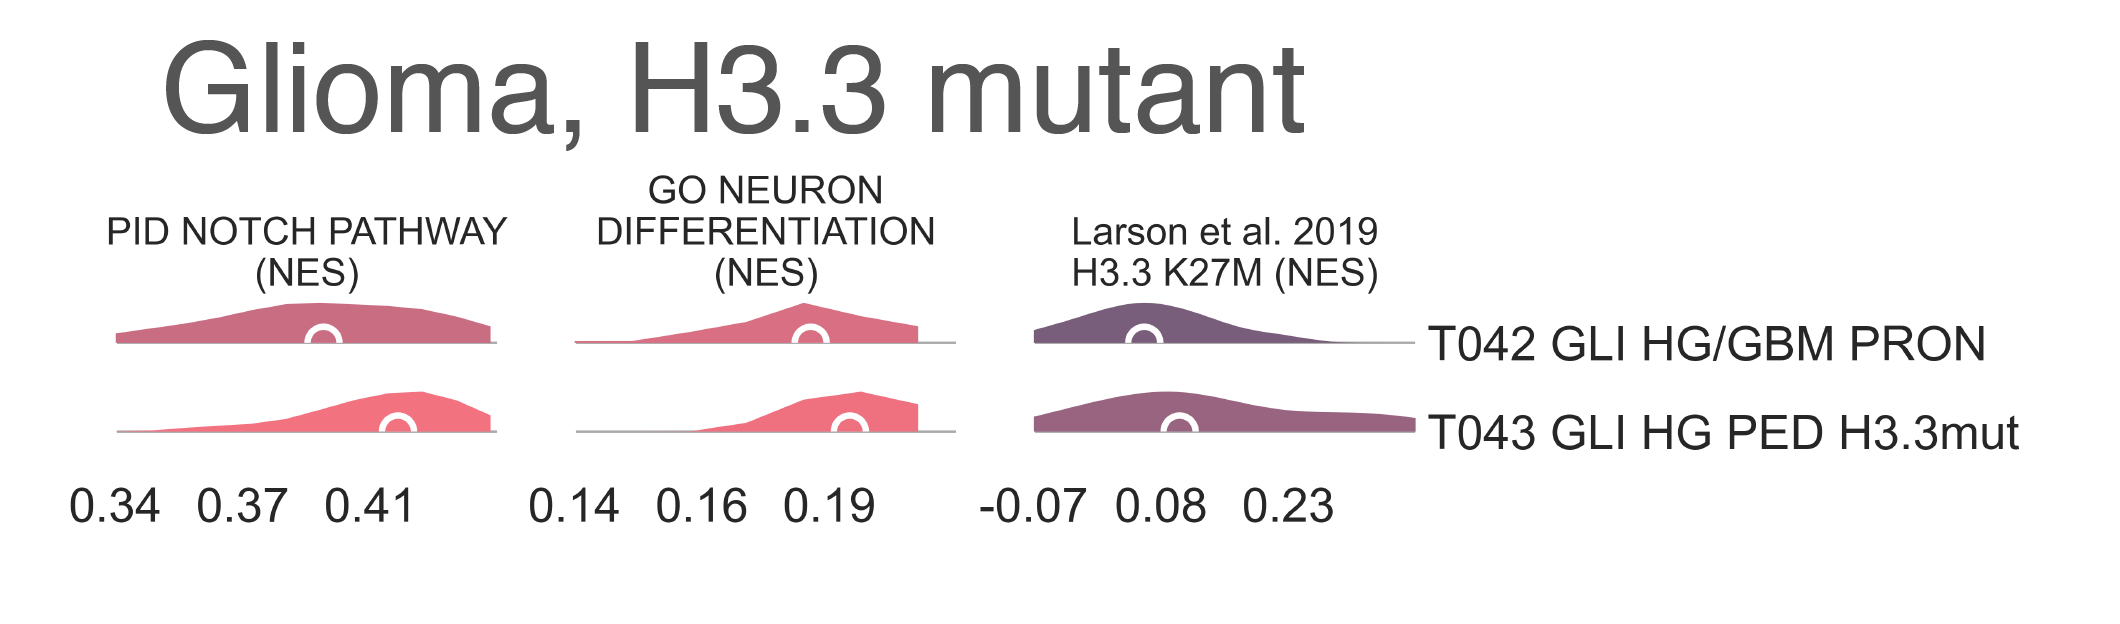
CNS5: Per sample Normalized Enrichment Score (NES) distributions of gene sets characterizing the H3.3-mutant glioma subtype.
The remaining subtypes are found in the child classes of T038 (Fig. CNS1): we find the majority of classical samples (31/34 vs 2/27, vs 1/43, χ2 p-val < 2.2e-16) in T039 GLI HG/GBM CLASS (n = 37), mesenchymal subtype samples in both T040 GLI HG/GBM MES (n = 36) and T041 GLI HG/GBM NEUR (n=57) (3/34 vs. 24/27 vs. 38/43, χ2 p-val = 3.28e-14). T040 contains two concurrent PIK3CA and NF1-mutated samples (χ2 p-val = 2.73e-02), NF1 mutations are typical of mesenchymal GBM [Fadhlullah2019]. T041 inherits all IDH1-mutants (0/34 vs. 0/26 vs. 10/42, χ2 p-val = 3.64e-04) and is enriched for TP53 mutants (0/5 vs. 0/5 vs 5/6, χ2 p-val = 1.38e-2). Patients at T039 have the best overall survival, reaching median OS at 375 days post diagnosis, while those in T040 have the worst, reaching median OS at 225 days (lrt p-val = 3.44e-02 at 2549 days). These clusters differ in their share of TERT promoter mutations and ATRX mutations when available, respectively, with T039 and T040 comprised of samples with TERT promoter mutants (8/8 vs. 9/9 vs. 4/9, χ2 p-val = 2.89e-03) while T041 contains all ATRX-mutants (0/33 vs. 0/25 vs. 7/40, χ2 p-val = 4.23e-03). Examination of telomere maintenance pathways reveals samples with relevant data in T041 to be driven more by ATRX mutations (0/8 vs. 0/8, 4/5, χ2 p-val =1.4513-02) while its siblings are wholly driven by TERT mutations (8/8, 8/8, 4/5, χ2 p-val = 3.87e-03). Analysis of gene sets for relevant pathways shows T040 to be enriched for mesenchymal GBM over its siblings (medNES ≥ 1.27, KW adj. p-val = 8.91e-14, Dunn adj. p-val < 1e-04), while T041 is enriched for neural GBM (medNES ≥ 1.38, KW adj. p-val = 5.59e-14, Dunn adj. p-val < 1e-04), suggesting this subtype has a more neural than mesenchymal identity. This is further supported by T041’s inheritance of the majority of neural (0/34 vs. 1/27 vs. 2/43, χ2 p-val = 4.60e-01) and proneural samples (0/34 vs. 0/27 vs. 2/43, χ2 p-val = 2.35e-01), though neither reach significance.
While it is surprising to see two unrelated clusters of glioblastomas containing large populations of classical expression subtype glioblastomas, T037 and T039, closer examination reveals T039 to represent a bona fide classical GBM subtype, supported by significant enrichment of classical glioblastoma gene signatures (medNES 1.15, MWU adj. p-val = 1.61e-08), and by its higher proportion of classical samples (31/34 vs. 49/68, FET p-val = 3.94e-02) (Fig. CNS6). T037 is instead enriched for neural (medNES = 1.79, MWU adj. p-val = 1.87e-13) and proneural signatures (medNES = 1.15, MWU adj. p-val = 8.81e-05) over T039 (Fig. CNS6). Furthermore, the presence of a sizeable astrocytoma/glioma component in T037 suggests it may represent a more “mixed” phenotype of glioma than its sibling T038, whose children separate into histotype-specific component clusters of GBM. Indeed, T037 is enriched for neural and proneural signatures against all children of T038 (medNES ≤ 1.04, KW adj. p-val ≤ 4.07e-16) (Fig. CNS6). We hypothesize T037 represents a more neurally differentiated class, transcending canonical subtyping. This is further supported by enrichment of genes pertaining to neural development (medNES = 1.06, KW adj. p-val = 7.01e-14, Dunn adj. p-val < 0.05) and differentiation (medNES = 1.11, KW adj. p-val = 2.24e-12, Dunn adj. p-val < 0.001) [TGOC2019], [Ashburner2000] in T037 with respect to T039, T040, and T041 (Fig. CNS6).
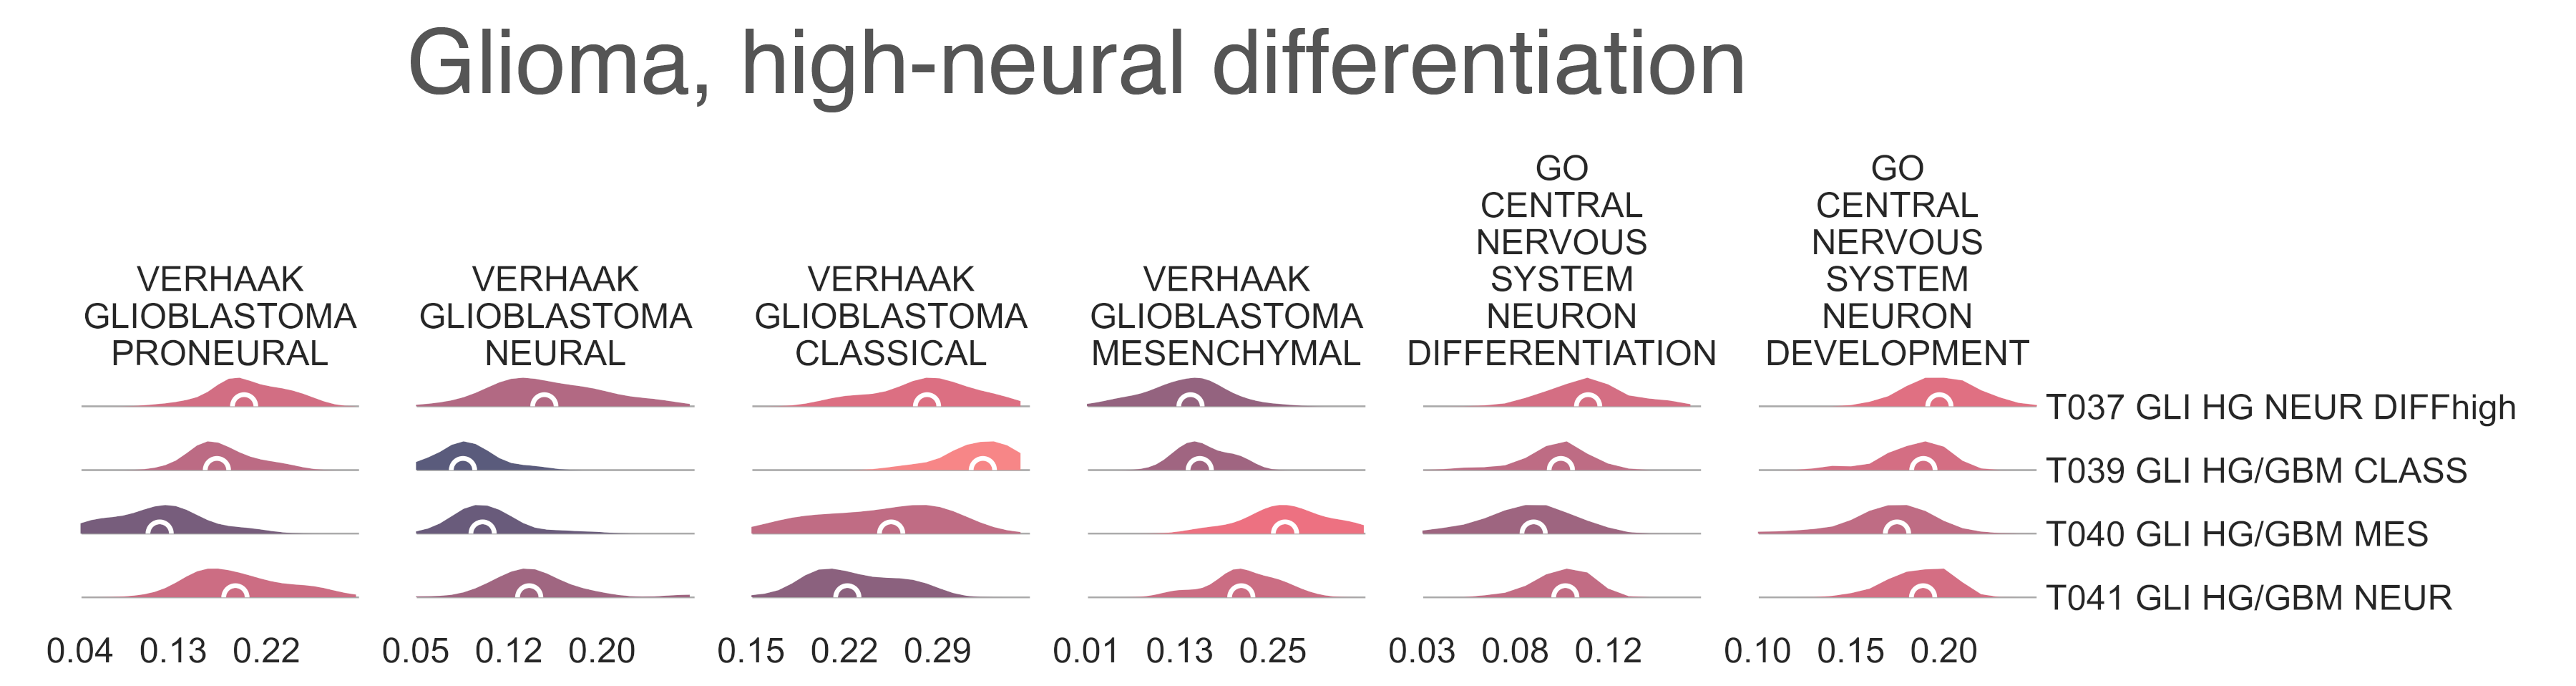
CNS6: Per sample Normalized Enrichment Score (NES) distributions of gene sets characterizing gliomas with high neural differentiation.
IDH-mutant glioma
Along the alternative branch hosting IDH-mutant gliomas (T029) we find that the hemizygous codeletion of chromosome arms 1p and 19q is a major driver in the separation of classes: we find samples with codeletion in T044 GLI IHDmut CODEL Glioblastoma, IDH-mutant 1p19q codeletion) (n = 270) and samples without codeletion in T045 GLI IDHmut noCODEL (n = 218) (168/ 221 vs. 1/213, χ2 p-val < 2.2e-16) (Fig. CNS1, c). Though T044 has significantly older patients (median age 40 vs. 36 y.o. MWU p-val = 2.56e-03), it has a slightly larger pediatric population (28.14% vs. 25.69%). According to the clinical information from TGCA, T044 contains significantly more tumors with TERT promoter mutations (89/125 vs. 6/124, χ2 p-val < 2.2e-16), while T045 is enriched for ATRX mutants (23/ 221 vs. 155/211, χ2 p-val < 2.2e-16). T044 contains a majority of oligodendrogliomas (134/198 vs. 28/183, χ2 p-val < 2.2e-16) while T045 contains a majority of astrocytomas (17/198 vs. 97/183, χ2 p-val < 2.2e-16). However, despite differences in codeletion status, we find no difference in overall survival between the two groups (lrt p-val = 3.78e-01 at 5546 days). Following along T044, we observe the singling out of a small set of low-grade gliomas (n = 12/30 vs 4/240, χ2 p-val = 1.54e-15) and dysembryoplastic neuroepithelial tumors (DNET) (10/30 vs. 2/240, χ2 p-val = 1.67e-14) in T046 GLI LG IDHmut CODEL/DNET (n = 30) from the rest of the gliomas in T047 GLI IHDmut CODEL A (n = 240). There is a significant age disparity between the two clusters (14.11 vs. 41 y.o., MWU p-val = 9.61e-11) as the former class is made up entirely of pediatric samples. T047 further split by age and histotype. T048 GLI IHDmut MULTICELL NET (n = 67) has significantly younger patients than T049 GLI IHDmut CODEL B (n = 173) (median 35.00 vs 44.00 y.o. MWU p-val = 2.26e-03) due to its larger pediatric component (38.80% vs. 11.56%, χ2 p-val = 3.70e-06). There is no difference in overall survial (lrt p-val = 6.23e-02 at 5546 days). While T048 contains more astrocytomas (13/48 vs 4/150, χ2 p-val = 7.06e-07), T049 has a considerably higher oligodendroglioma population (20/48 vs 114/150, χ2 p-val = 2.14e-05). According to TCGA data, T048 is enriched for EGFR (3/33 vs. 0/87, χ2 p-val = 2.83e-02), ATRX (12/33 vs. 6/87, χ2 p-val = 1.77e-04) and TP53-mutant tumors (13/33 vs. 7/87, χ2 p-val = 1.23e-04), while T049 contains more CIC (χ2 p-val = 1/33 vs. 48/87, 6.33e-07), FUBP1 (1/33 vs. 22/87, χ2 p-val = 1.22e-02) and NOTCH1 (0/33 vs. 19/87, χ2 p-val = 8.14e-03) mutants (Fig. CNS7). Most tumors in T048 are neural (46/49 vs. 38/144, χ2 p-val = 7.39e-16), while the majority of those in T049 are proneural (2/49 vs. 105/144, χ2 p-val = 2.26e-16). Most importantly, and quite unexpectedly, T048 is mostly composed of IDH1 wild-type (16/53) and non-codeleted samples (45/53). It is not clear why this class is found within the IDH1-codeleted branch.
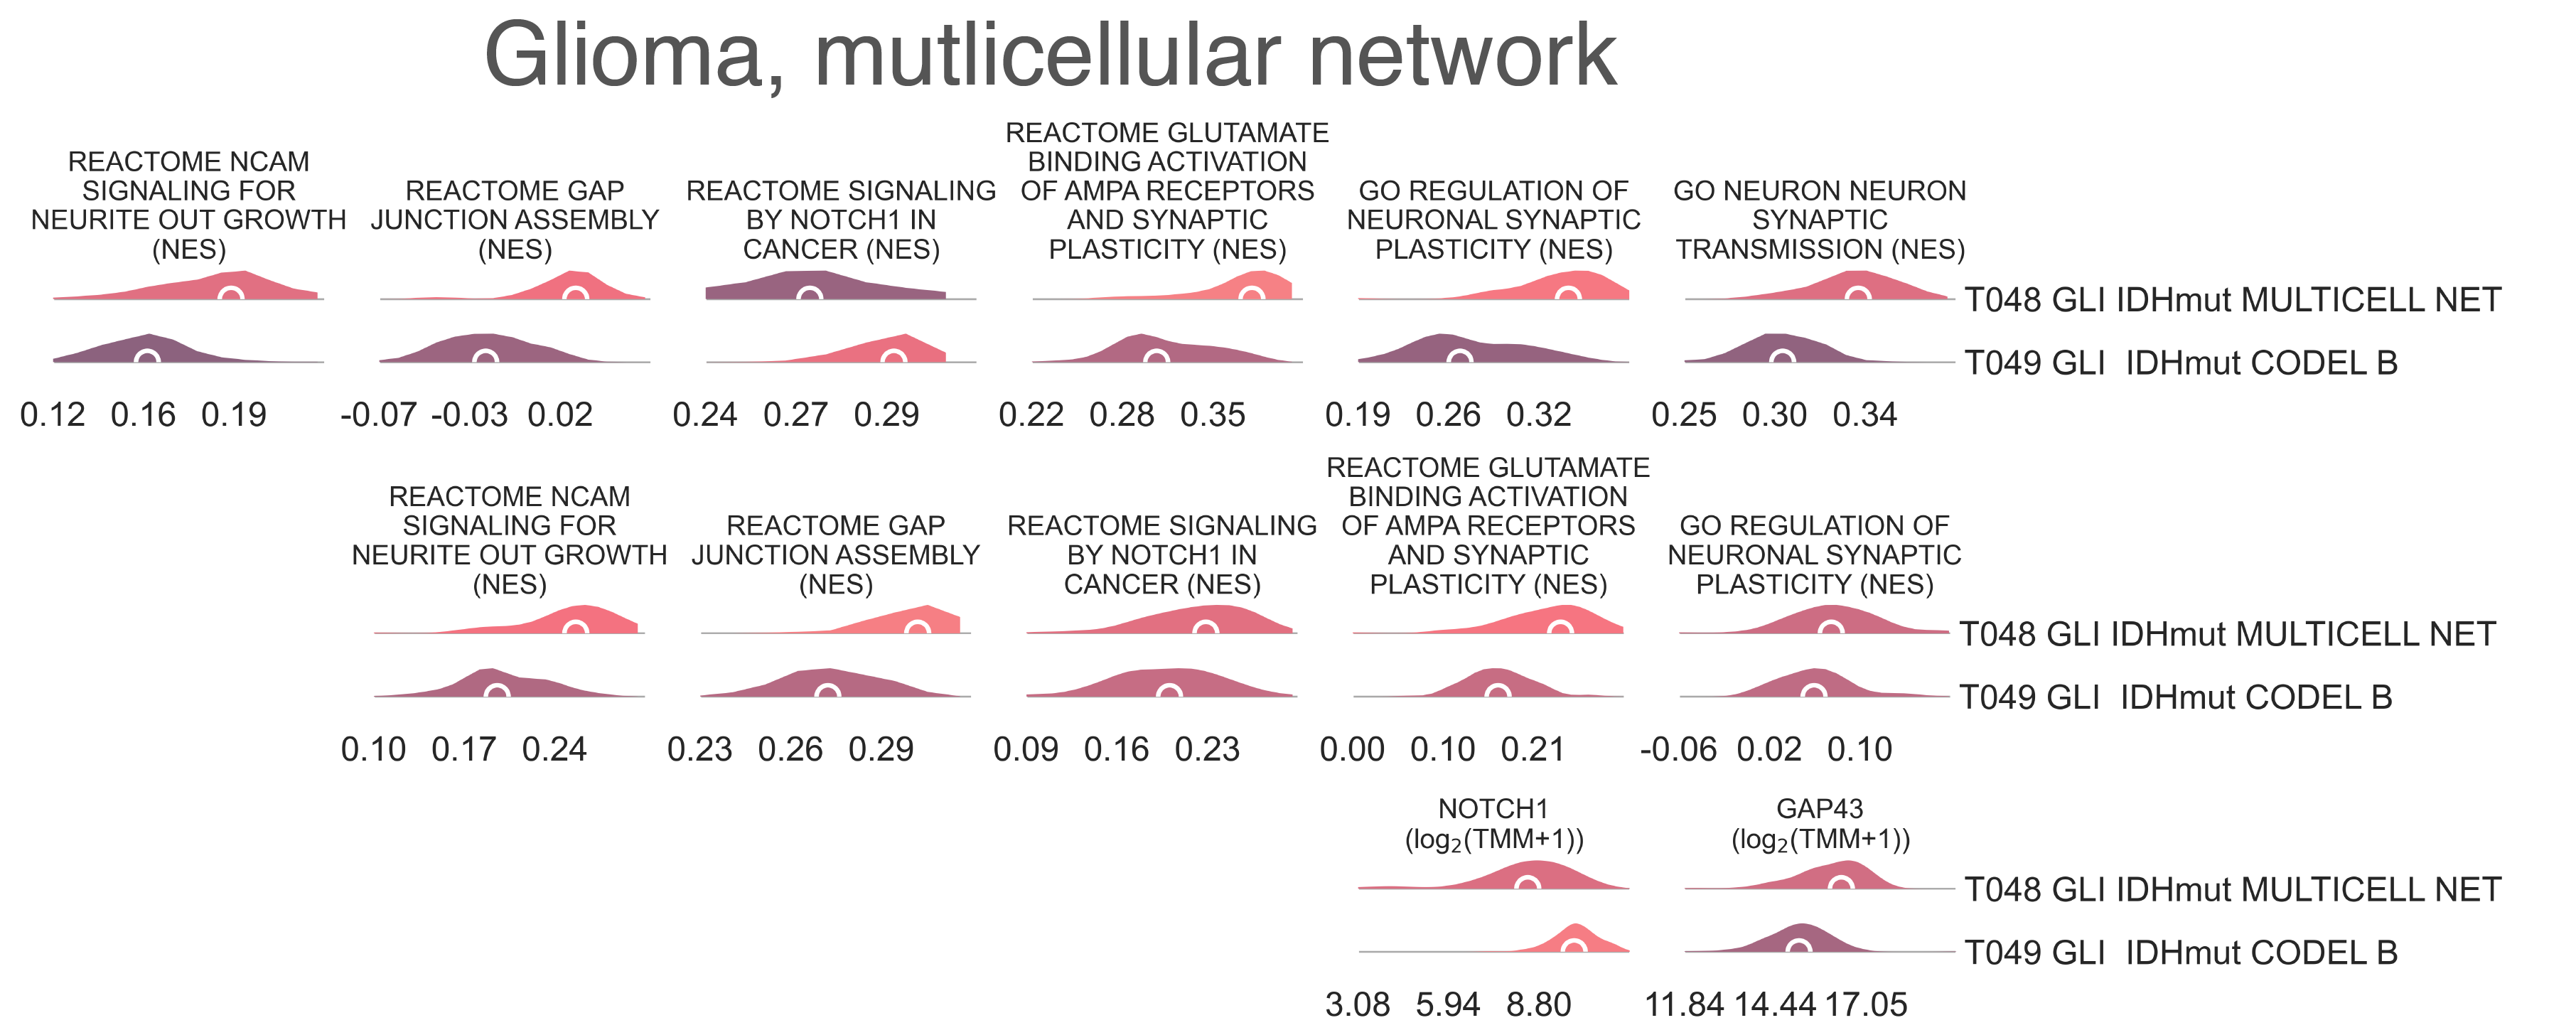
CNS7: Top and center, per sample Normalized Enrichment Score (NES) distributions of gene sets characterizing the gliomas subtype with multicellular network overexpression. Bottom, per sample expression distributions of NOTCH1 and GAP43 genes in gliomas subtypes with or without multicellular network overexpression.
Gene set enrichment analysis reveals that every locus available for chr1p, with the expectation of chr1p11, (MWU p-val ≤ 8.35e-04) and chr19q (MWU p-val ≤ 5.18e-23) are significantly downregulated in T049 compared to T048, confirming more severe population-wide loss of these loci in T049 vs. T048 and supporting that, true to their annotation, the majority of samples in T048 have normal expression of these loci, in spite of their transcriptional similarities with the codeleted branch. The overall expression profile of both IDH wild type and non-codeleted tumors within T048 have a high correlation with true chr1p/19q co-deleted IDHmut gliomas within T044 (R ≥ 0.802, Pearson correlation p-val < 2.20e-16). Further examination of gene sets upregulated in T048 compared to its sibling class T049, its uncle class T045 GLI IDHmut noCODEL, and its cousin class T030 GLI IDHwt revealed significant upregulation of genesets related to neuron-neuron synaptic transmission (KW adj. p-val = 2.35e-89, medNES = 1.13, Dunn adj. p-val-val < 1.00e-04), synaptic plasticity (KW adj. p-val = 5.23e-85, medNES = 1.30, Dunn adj. p-val-val < 1.00e-04), neurite formation (KW adj. p-val = 2.45e-51, medNES = 1.15, Dunn adj. p-val < 1.00e-04) [Jassal2020], and microtubule polymerization (KW adj. p-val = 1.59e-63, medNES = 1.10, Dunn adj. p-val-val < 1.00e-04) (Fig. CNS7). We also observe upregulation of glutaminergic signalling (KW adj. p-val = 1.06e-102, medNES = 1.31, Dunn adj. p-val = 9.08e-59, medNES = 1.43, Dunn adj. p-val < 1.00e-04), including AMPA-dependent synaptic plasticity (KW adj. p-val = 7.36-84, Dunn adj. p-val < 1.00e-04), and of extracellular calcium export (KW adj. p-val = 7.61e-93, Dunn adj. p-val < 1.00e-04, medNES = 1.14) [Venkataramani2019], [Venkatesh2019], [Jassal2020] (Fig. CNS7). We also observe increases in gap junction formation (KW adj. p-val = 5.81e-35, medNES = 2.39, Dunn adj. p-val < 1.00e-04) and connexin binding (KW adj. p-val = 3.61e-28, medNES = 1.26, Dunn adj. p-val < 1.00e-04) (Fig. CNS7). Taken together, these results suggest T048 to be composed of gliomas of a recently described multicellular network phenotype, a pro-invasive and radioresistant resistant mode of glioma growth [Osswald2015]. Gene expression analysis reveals significant upregulation of GAP34 in T048 vs. other IDH1-mutant tumor groups (T045 and T049) (medLogFC = 1.33, FDR ≤ 1.80e-13), the principal gap-junction protein mediating this phenotype [Osswald2015], as well as NOTCH1 underexpression (medLogFC ≤ 1.950e-06) and downregulation of NOTCH1 signalling (KW adj. p-val = 1.65e-45, medNES = 0.92, Dunn adj. p-val-val < 0.05) [Jassal2020] over all other glioma types, the crucial determinant of this phenotype [Jung2021] (Fig. CNS7). This is despite the lack of NOTCH1-mutant samples in T048; T049 contains the majority NOTCH1 mutants of the glioma cohort (vs. T048, T045, and T030, 0/33 vs. 19/87 vs. 4/113 vs. 0/52, χ2 p-val = 2.29e-07) and exhibits the highest NOTCH1 expression (medLogFC ≤ 2.961e-02), so we speculate these NOTCH1 mutations to be gain-of-function. However, despite this phenotype displaying radioresistance, samples in T048 show no significant differences in overall survival compared to other IDH-mutated glioma groups (T045 and T049) at 6423 days. We speculate this novel phenotype may have good transcriptional affinity with chr1p/19q codeletion, in spite of the lack of apparent lesions in the region. Though this phenotype is mostly associated with astrocytomas [Osswald2015], T048 is a mixed cluster – containing large amounts of both astrocytomas and oligodendrogliomas. T048 then splits in two classes (Fig. CNS1), with different histological populations; T050 GLI IDHmut MULTICELL NET OLIGOD (n = 31) contains more oligodendrogliomas (15/22 vs. 5/26, χ2 p-val = 1.73-3) than T051 GLI IDHmut MULTICELL NET ASTROC (n = 36), which instead is populated by astrocytomas (0/22 vs. 13/26, χ2 p-val = 3.74e-04) [Davare2018], [Zhang2017]. T050 also inherits the majority of chr1p/19q codelted samples (7/16 vs. 1/29, χ2 p-val = 1.91e-02). Similarly, T049 splits by histological composition (Fig. CNS1) with T052 GLI IHDmut CODEL NOTCH1 (n = 89) being enriched (68/81 vs. 46/69, χ2 p-val = 2.27e-02) for oligodendrogliomas and T053 GLI IHDmut CODEL OLIGOAST (n = 84) for oligoastrocytomas (11/81 vs. 21/69, χ2 p-val = 2.08e-02). T052 also has a significantly higher population of NOTCH1 mutant samples (17/56 vs. 2/39, χ2 p-val = 2.07e-02). T051 contains a larger share of neural gliomas (30/78 vs. 8/66, χ2 p-val = 7.154e-04), while T052 contains more proneural gliomas (48/78 vs. 57/66, χ2 p-val = 1.623-03). Finally, following along the non-codeleted branch defined by T045, we observe four children classes, characterized by significant differences in the sex ratios (Fig. CNS1): T054 GLI IDHmut noCODEL OLIGOC (n = 99) is composed by 63.64% of males, T055 GLI IDHmut noCODEL NEUR DIFFhigh (n = 30) is entirely female (χ2 p-val = 2.65e-17), T056 GLI IDHmut noCODEL MES (n = 24) is 75.00% male and T057 GLI IDHmut noCODEL H3demet (n = 47) is almost exclusively male (97.87% χ2 p-val = 2.65e-17). Although sex differences have previously been reported to be associated with differences in survival in glioma and GBM [Yang2019], patients in these clusters have no significant differences in overall survival (lrt p-val = 1.44e-01 at 4752 days).
Differential expression and gene sets analyses on these classes revelated that T054 is enriched for oligodendrocyte development (medNES = 1.03, adj p-val = 4.85e-15) and myelination (medNES = 1.23, KW adj. p-val = 3.97e-09, Dunn adj. p-val < 0.01) [TGOC2019], [Ashburner2000], and overexpresses MBP and MOBP (FDR ≤ 2.461e-04), predictors of improved survival [Wang2019], [Kong2013]. T055 is enriched for gene sets related to neuronal development (medNES ≥ 1.01, KW adj. p-val = 9.36e-17). T056 is enriched for genesets involving MYC signalling (medNES ≥ 1.04, KW adj. p-val ≤ 6.76e-03, Dunn adj. p-val < 0.05), the G2M checkpoint,(medNES ≥ 1.16, KW adj. p-val = 1.46e-03, Dunn adj. p-val < 0.01), and the immune response (medNES ≥ 1.510, KW adj. p-val ≤ 1.05e-05, Dunn adj. p-val < 0.01) [Liberzon2015]; it also exhibits the highest immune infiltration score out of its siblings (median = 990 vs. 648 vs. 2185 vs. 977, Dunn adj. p-val ≤ 4.81e-05). It overexpresses MMP9 (medLogFC = 1.41, FDR ≤ 3.515e-02), CHI3L1 (medLogFC = 1.79, FDR 8.332e-03), S100A4 (medLogFC ≤ 4.281e-09), EN1 (medLogFC ≤ 8.643e-14), and ANXA1 (medLogFC ≤ 7.266e-14), markers of poor prognosis, and IGF2BP3 (medLogFC ≤ 8.147e-13), a glioblastoma-specific proliferative and invasive marker. T056 is also the only cluster to contain a significant population of mesenchymal samples (0/58 vs. 0/21 vs. 5/11 vs. 2/ 35, χ2 p-val = 3.211e-08) and is enriched for epithelial mesenchymal transition genesets (medNES ≥ 1.15, KW adj. p-val = 4.46e-07, Dunn adj. p-val < 0.05) [Liberzon2015]. T057 is enriched for genesets involving H3K4 demethylation (medNES ≥ 1.07, KW adj. p-val ≤ 6.91e-11, Dunn adj. p-val < 0.05) and H3K27 demethylation (medNES ≥ 1.08, KW adj. p-val ≤ 6.00e-03) [TGOC2019], [Ashburner2000]. It also overexpresses LDHC (median LogFC= 3.44, FDR ≤ 7.16e-06), which was found to be elevated in mesenchymal glioma stem cells and negatively correlates with survival [Mao2013], [Beckner2016].
Bibliography
- Ashburner2000(1,2,3)
Ashburner, M., Ball, C.A., Blake, J.A.,2000. Gene Ontology: tool for the unification of biology. Nature Genetics 25(1), pp. 25–29.
- Beck2011
Beck, S., Jin, X., Sohn, Y.-W.,2011. Telomerase activity-independent function of TERT allows glioma cells to attain cancer stem cell characteristics by inducing EGFR expression. Molecules and Cells 31(1), pp. 9–15.
- Beckner2016
Beckner, M.E., Pollack, I.F., Nordberg, M.L. and Hamilton, R.L. 2016. Glioblastomas with copy number gains in EGFR and RNF139 show increased expressions of carbonic anhydrase genes transformed by ENO1. BBA clinical 5, pp. 1–15.
- Brennan2013
Brennan, C.W., Verhaak, R.G.W., McKenna, A.,2013. The somatic genomic landscape of glioblastoma. Cell 155(2), pp. 462–477.
- Ceccarelli2016(1,2,3,4)
Ceccarelli, M., Barthel, F.P., Malta, T.M.,2016. Molecular profiling reveals biologically discrete subsets and pathways of progression in diffuse glioma. Cell 164(3), pp. 550–563.
- Chen2020
Chen, K.-Y., Bush, K., Klein, R.H.,2020. Reciprocal H3.3 gene editing identifies K27M and G34R mechanisms in pediatric glioma including NOTCH signaling. Communications Biology 3(1), p. 363.
- Cimino2018(1,2)
Cimino, P.J., Kim, Y., Wu, H.-J.,2018. Increased HOXA5 expression provides a selective advantage for gain of whole chromosome 7 in IDH wild-type glioblastoma. Genes & Development 32(7–8), pp. 512–523.
- Davare2018
Davare, M.A., Henderson, J.J., Agarwal, A.,2018. Rare but recurrent ROS1 fusions resulting from chromosome 6q22 microdeletions are targetable oncogenes in glioma. Clinical Cancer Research 24(24), pp. 6471–6482.
- Fadhlullah2019
Fadhlullah, S.F.B., Halim, N.B.A., Yeo, J.Y.T.,2019. Pathogenic mutations in neurofibromin identifies a leucine-rich domain regulating glioma cell invasiveness. Oncogene 38(27), pp. 5367–5380.
- Gearhart2006
Gearhart, M.D., Corcoran, C.M., Wamstad, J.A. and Bardwell, V.J. 2006. Polycomb group and SCF ubiquitin ligases are found in a novel BCOR complex that is recruited to BCL6 targets. Molecular and Cellular Biology 26(18), pp. 6880–6889.
- Hänzelmann2013
Hänzelmann, S., Castelo, R. and Guinney, J. 2013. GSVA: gene set variation analysis for microarray and RNA-seq data. BMC Bioinformatics 14, p. 7.
- Hartmann2010
Hartmann, C., Hentschel, B., Wick, W.,2010. Patients with IDH1 wild type anaplastic astrocytomas exhibit worse prognosis than IDH1-mutated glioblastomas, and IDH1 mutation status accounts for the unfavorable prognostic effect of higher age: implications for classification of gliomas. Acta Neuropathologica 120(6), pp. 707–718.
- Hernández2010
Hernández, M., Martín, R., García-Cubillas, M.D., Maeso-Hernández, P. and Nieto, M.L. 2010. Secreted PLA2 induces proliferation in astrocytoma through the EGF receptor: another inflammation-cancer link. Neuro-oncology 12(10), pp. 1014–1023.
- Jassal2020(1,2,3)
Jassal, B., Matthews, L., Viteri, G.,2020. The Reactome Pathway Knowledgebase. Nucleic Acids Research 48(D1), pp. D498–D503.
- Jung2021
Jung, E., Osswald, M., Ratliff, M.,2021. Tumor cell plasticity, heterogeneity, and resistance in crucial microenvironmental niches in glioma. Nature Communications 12(1), p. 1014.
- Kanehisa2000(1,2)
Kanehisa, M. and Goto, S. 2000. KEGG: Kyoto encyclopedia of genes and genomes. Nucleic Acids Research 28(1), pp. 27–30.
- Kao2018
Kao, Y.-C., Owosho, A.A., Sung, Y.-S.,2018. BCOR-CCNB3 Fusion Positive Sarcomas: A Clinicopathologic and Molecular Analysis of 36 Cases With Comparison to Morphologic Spectrum and Clinical Behavior of Other Round Cell Sarcomas. The American Journal of Surgical Pathology 42(5), pp. 604–615.
- Kao2020
Kao, Y.-C., Sung, Y.-S., Argani, P.,2020. NTRK3 overexpression in undifferentiated sarcomas with YWHAE and BCOR genetic alterations. Modern Pathology 33(7), pp. 1341–1349.
- Kong2013
Kong, J., Cooper, L.A.D., Wang, F.,2013. Machine-based morphologic analysis of glioblastoma using whole-slide pathology images uncovers clinically relevant molecular correlates. Plos One 8(11), p. e81049.
- Larson2019
Larson, J.D., Kasper, L.H., Paugh, B.S.,2019. Histone H3.3 K27M accelerates spontaneous brainstem glioma and drives restricted changes in bivalent gene expression. Cancer Cell 35(1), p. 140–155.e7.
- Liberzon2015(1,2,3)
Liberzon, A., Birger, C., Thorvaldsdóttir, H., Ghandi, M., Mesirov, J.P. and Tamayo, P. 2015. The Molecular Signatures Database (MSigDB) hallmark gene set collection. Cell Systems 1(6), pp. 417–425.
- Mao2013
Mao, P., Joshi, K., Li, J.,2013. Mesenchymal glioma stem cells are maintained by activated glycolytic metabolism involving aldehyde dehydrogenase 1A3. Proceedings of the National Academy of Sciences of the United States of America 110(21), pp. 8644–8649.
- Nishimura2001
Nishimura, D. 2001. BioCarta. Biotech Software & Internet Report 2(3), pp. 117–120.
- Northcott2012
Northcott, P.A., Dubuc, A.M., Pfister, S. and Taylor, M.D. 2012. Molecular subgroups of medulloblastoma. Expert Review of Neurotherapeutics 12(7), pp. 871–884.
- Osswald2015(1,2,3)
Osswald, M., Jung, E., Sahm, F.,2015. Brain tumor cells interconnect to a functional and resistant network. Nature 528(7580), pp. 93–98.
- Park2016
Park, S.Y., Piao, Y., Jeong, K.J., Dong, J. and de Groot, J.F. 2016. Periostin (POSTN) regulates tumor resistance to antiangiogenic therapy in glioma models. Molecular Cancer Therapeutics 15(9), pp. 2187–2197.
- Paugh2011
Paugh, B.S., Broniscer, A., Qu, C.,2011. Genome-wide analyses identify recurrent amplifications of receptor tyrosine kinases and cell-cycle regulatory genes in diffuse intrinsic pontine glioma. Journal of Clinical Oncology 29(30), pp. 3999–4006.
- Roversi2006
Roversi, G., Pfundt, R., Moroni, R.F.,2006. Identification of novel genomic markers related to progression to glioblastoma through genomic profiling of 25 primary glioma cell lines. Oncogene 25(10), pp. 1571–1583.
- Schaefer2009
Schaefer, C.F., Anthony, K., Krupa, S.,2009. PID: the pathway interaction database. Nucleic Acids Research 37(Database issue), pp. D674-9.
- Steponaitis2016
Steponaitis, G., Skiriutė, D., Kazlauskas, A.,2016. High CHI3L1 expression is associated with glioma patient survival. Diagnostic Pathology 11, p. 42.
- Sturm2016
Sturm, D., Orr, B.A., Toprak, U.H.,2016. New Brain Tumor Entities Emerge from Molecular Classification of CNS-PNETs. Cell 164(5), pp. 1060–1072.
- Tabuse2011
Tabuse, M., Ohta, S., Ohashi, Y.,2011. Functional analysis of HOXD9 in human gliomas and glioma cancer stem cells. Molecular Cancer 10, p. 60.
- Tachon2019
Tachon, G., Masliantsev, K., Rivet, P.,2019. Prognostic significance of MEOX2 in gliomas. Modern Pathology 32(6), pp. 774–786.
- TGOC2019(1,2,3)
The Gene Ontology Consortium 2019. The Gene Ontology Resource: 20 years and still GOing strong. Nucleic Acids Research 47(D1), pp. D330–D338.
- Thorsson2018
Thorsson, V., Gibbs, D.L., Brown, S.D.,2018. The immune landscape of cancer. Immunity 48(4), p. 812–830.e14.
- Venkataramani2019
Venkataramani, V., Tanev, D.I., Strahle, C.,2019. Glutamatergic synaptic input to glioma cells drives brain tumor progression. Nature 573(7775), pp. 532–538.
- Venkatesh2019
Venkatesh, H.S., Morishita, W., Geraghty, A.C.,2019. Electrical and synaptic integration of glioma into neural circuits. Nature 573(7775), pp. 539–545.
- Wang2019
Wang, S., Liu, F., Wang, Y.,2019. Integrated analysis of 34 microarray datasets reveals CBX3 as a diagnostic and prognostic biomarker in glioblastoma. Journal of Translational Medicine 17(1), p. 179.
- Xu2017(1,2)
Xu, Yonggang, Wang, J., Xu, Yanbin, Xiao, H., Li, J. and Wang, Z. 2017. Screening critical genes associated with malignant glioma using bioinformatics analysis. Molecular medicine reports 16(5), pp. 6580–6589.
- Yang2019
Yang, W., Warrington, N.M., Taylor, S.J.,2019. Sex differences in GBM revealed by analysis of patient imaging, transcriptome, and survival data. Science Translational Medicine 11(473).
- Zhang2017
Zhang, X., Lv, Q.-L., Huang, Y.-T., Zhang, L.-H. and Zhou, H.-H. 2017. Akt/FoxM1 signaling pathway-mediated upregulation of MYBL2 promotes p