T001 Neuroblastoma
Version: 0.1.0
Last change: May 07, 2022
A total of 180 samples were labelled as neuroblastoma in our reference dataset, 162 of which are from TARGET while the rest are from different sources within the TreeHouse initiative. RACCOON identified four separate subclusters within the neuroblastoma parent class (Fig. NEBLA1). They exhibit different molecular profiles and clinical outcomes, roughly overlapping with microarray expression clusters described in literature [Abel2011].
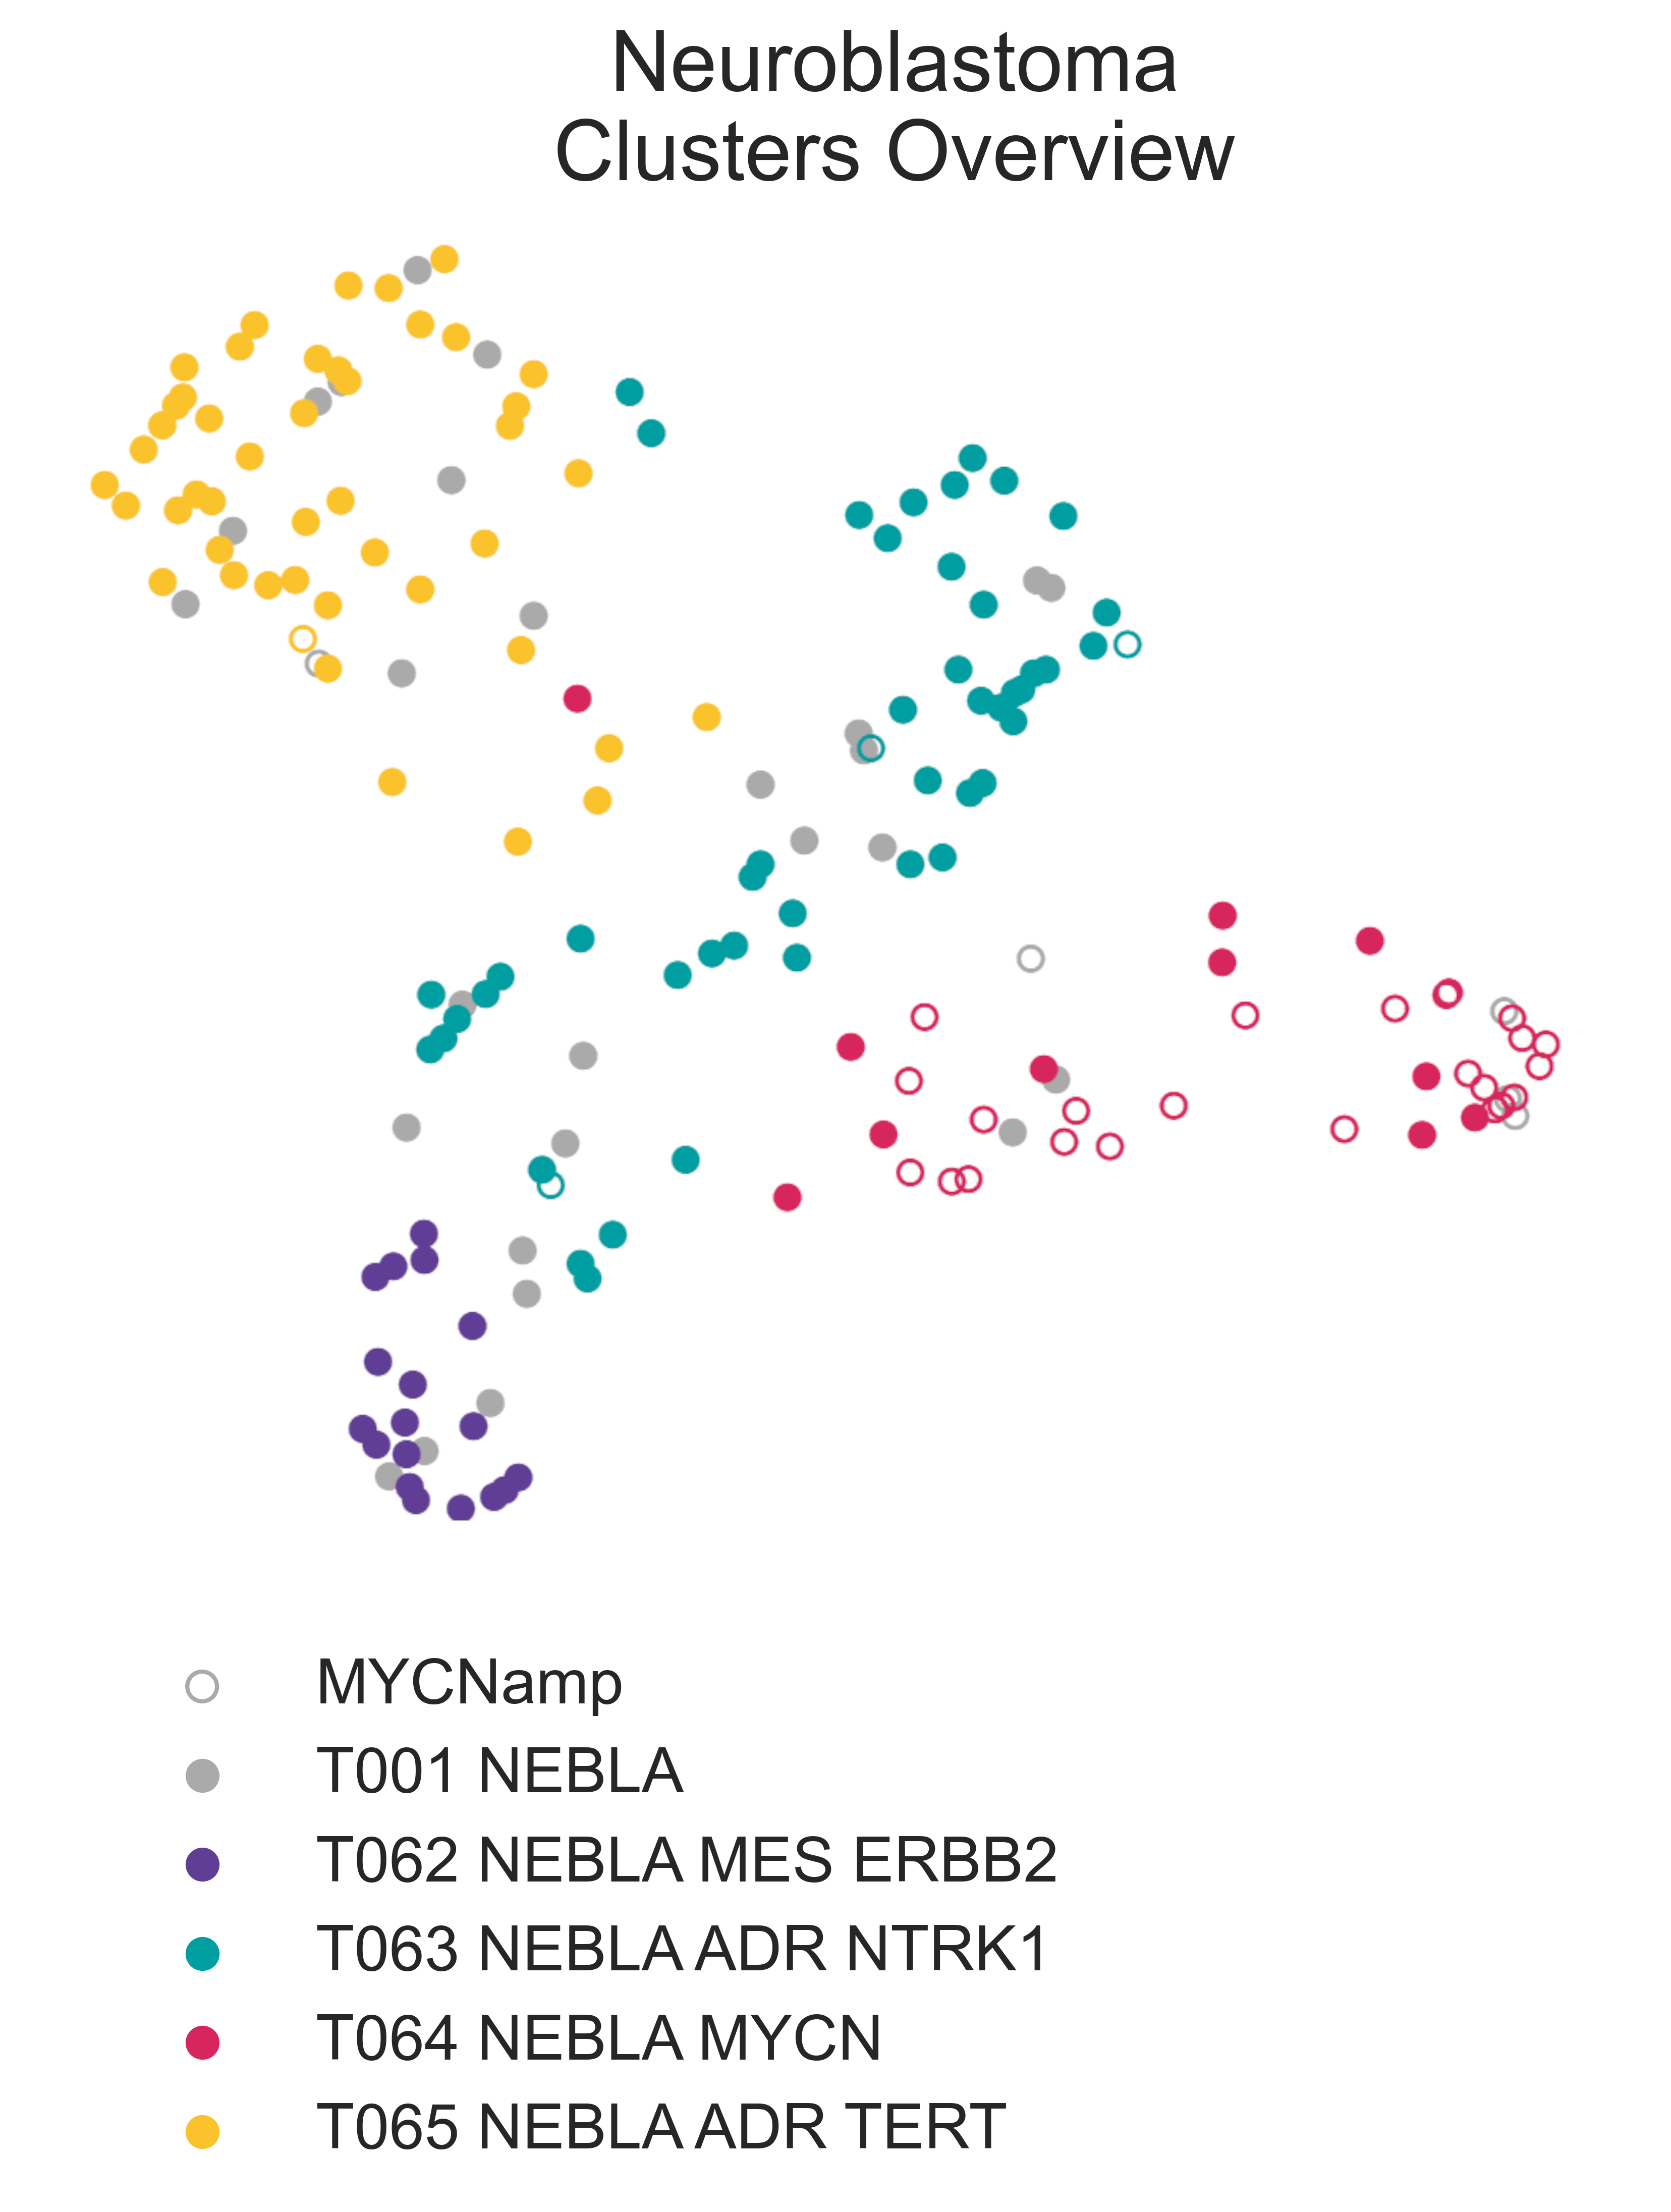
NEBLA1: On the left, a 2-dimensional UMAP projection of neuroblastma tumors by gene expression, where the four subtypes identified are shown in different colors. Empty circles represent samples that were reported as MYCN amplified by clinical tests.
T062 NEBLA MES ERBB2, the smallest cluster, contains a molecular signature which corresponds to microarray cluster p43 and comprises Children’s Oncology Group (COG) samples reported as high-risk (Fig. NEBLA2). It is characterized by underexpression of the neuroblastoma predisposition genes PHOX2B (glmQLFTest medLogFC = -2.58, FDR ≤ 2.93e-13), MYCN (medLogFC = -3.30, FDR ≤ 3.11e-09), as well as the cell-cycle genes BIRC5 (medLogFC = -5.92, FDR ≤ 2.90e-16) and CCND1 (medLogFC = -2.13, FDR ≤ 4.84e-12), compared to its sibling clusters. T062 NEBLA MES ERBB2 is also characterized by overexpression of ERBB2 (HER2) (medLogFC = 1.32, FDR < 8.16e-08), which has been demonstrated to be a favourable prognostic factor [Izycka-Swieszewska2010].
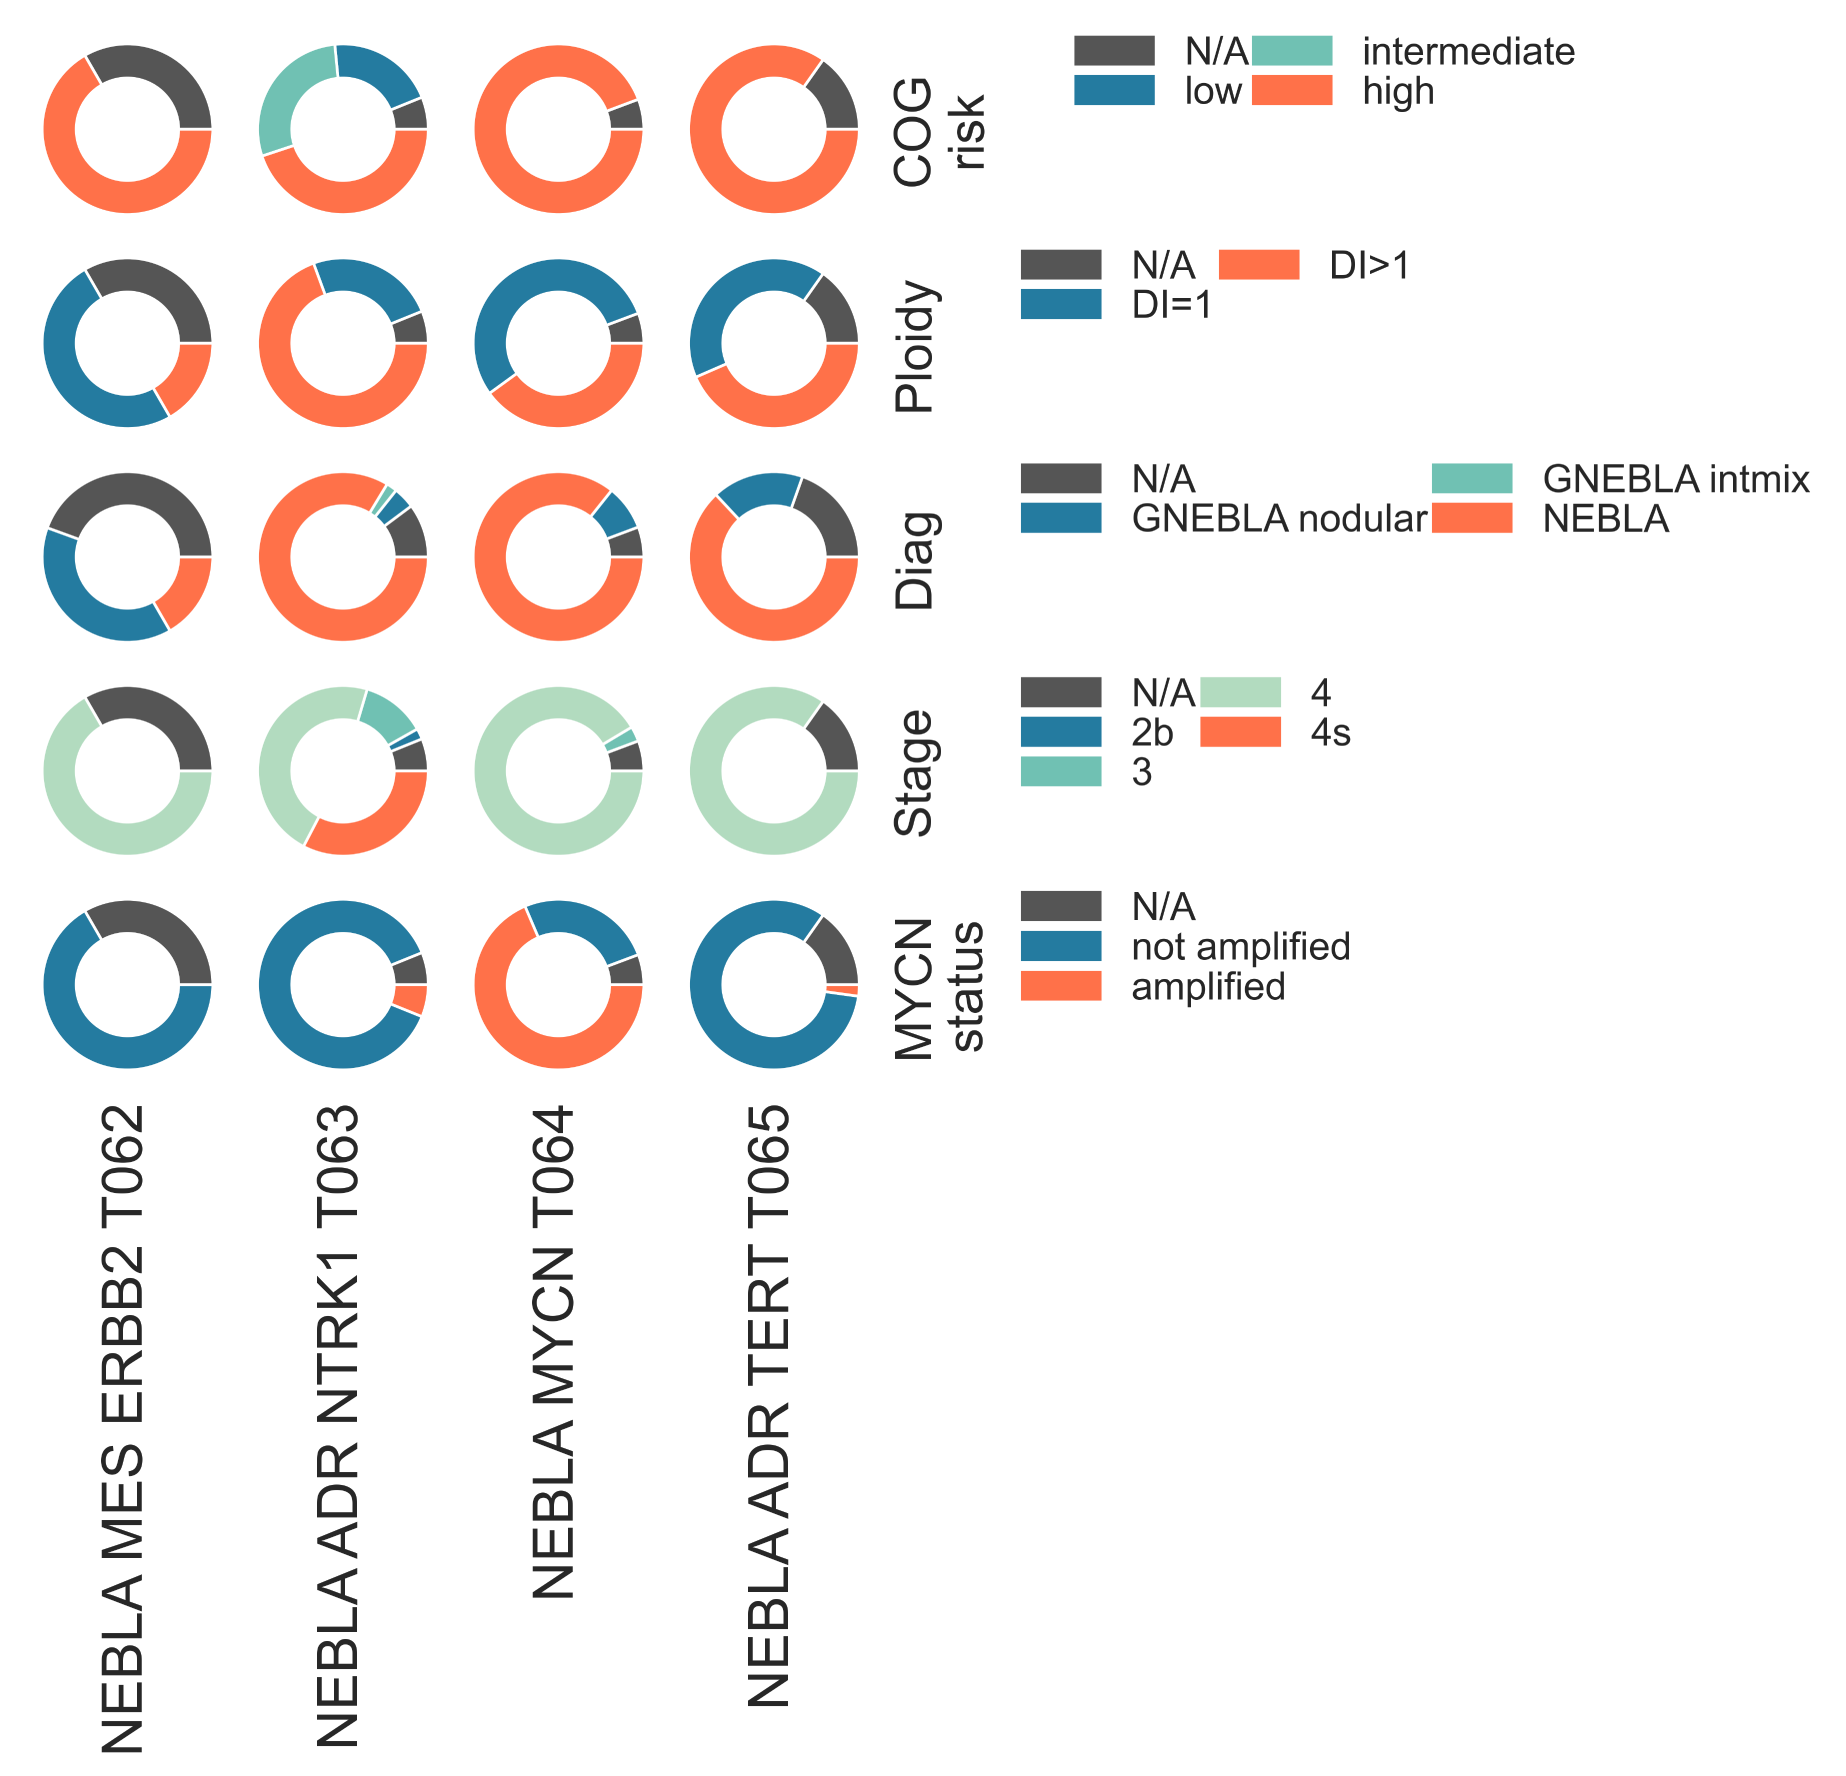
NEBLA2: Donut plot showing the samples stratification of the four identified neuroblastoma subtypes. These include (from top to bottom), COG risk group, Ploidy, Diagnosis, Stage and clinically reported MYCN status.
Enrichment of ERBB2 signalling is also seen in this cluster (ssGSEA medNES ≥ 1.31, KW adj. p-val = 1.25e-13, Dunn adj. p-val > 1.00e-02) [Ashburner2000], [TGOC2019]. Neuroblastomas expressing ERBB2 have increased differentiation, immunoreactivity, and patients show improved overall survival compared to patients with tumors with either low or no ERBB2 expression [Izycka-Swieszewska2010]. Indeed, we observe statistically significantly higher immune infiltration and lower stemness in this cluster (.38 median score, KW adj. p-val = 1.75e-12 respectively, see Methods for details on these scores), with respect to all the other classes (Fig. NEBLA3). Furthermore, T062 contains the majority of nodular ganglioneuroblastomas (7/12, χ2 p-val = 3.849e-05) (Fig. NEBLA2) and shows significant overexpression of ganglioneuroblastoma marker ERRB3 (medLogFC = 5.7, FDR ≤ 3.484e-15), as well as enrichment for ERBB network gene sets (medNES ≥ 1.27, KW p-val = 1.95e-09, Dunn adj. p-val < 1.00e-04) [Schaefer2009]. It also exhibits enrichment of glial cell developmental pathways (medNES ≥ 1.31, KW p-val = 2.55e-12, Dunn adj. p-val < 1.00e-03) and adrenal gland developmental gene sets (medNES ≥ 1.30, KW adj. p-val = 2.14e-12, Dunn adj. p-val < 1.00e-02) [Ashburner2000], [TGOC2019].
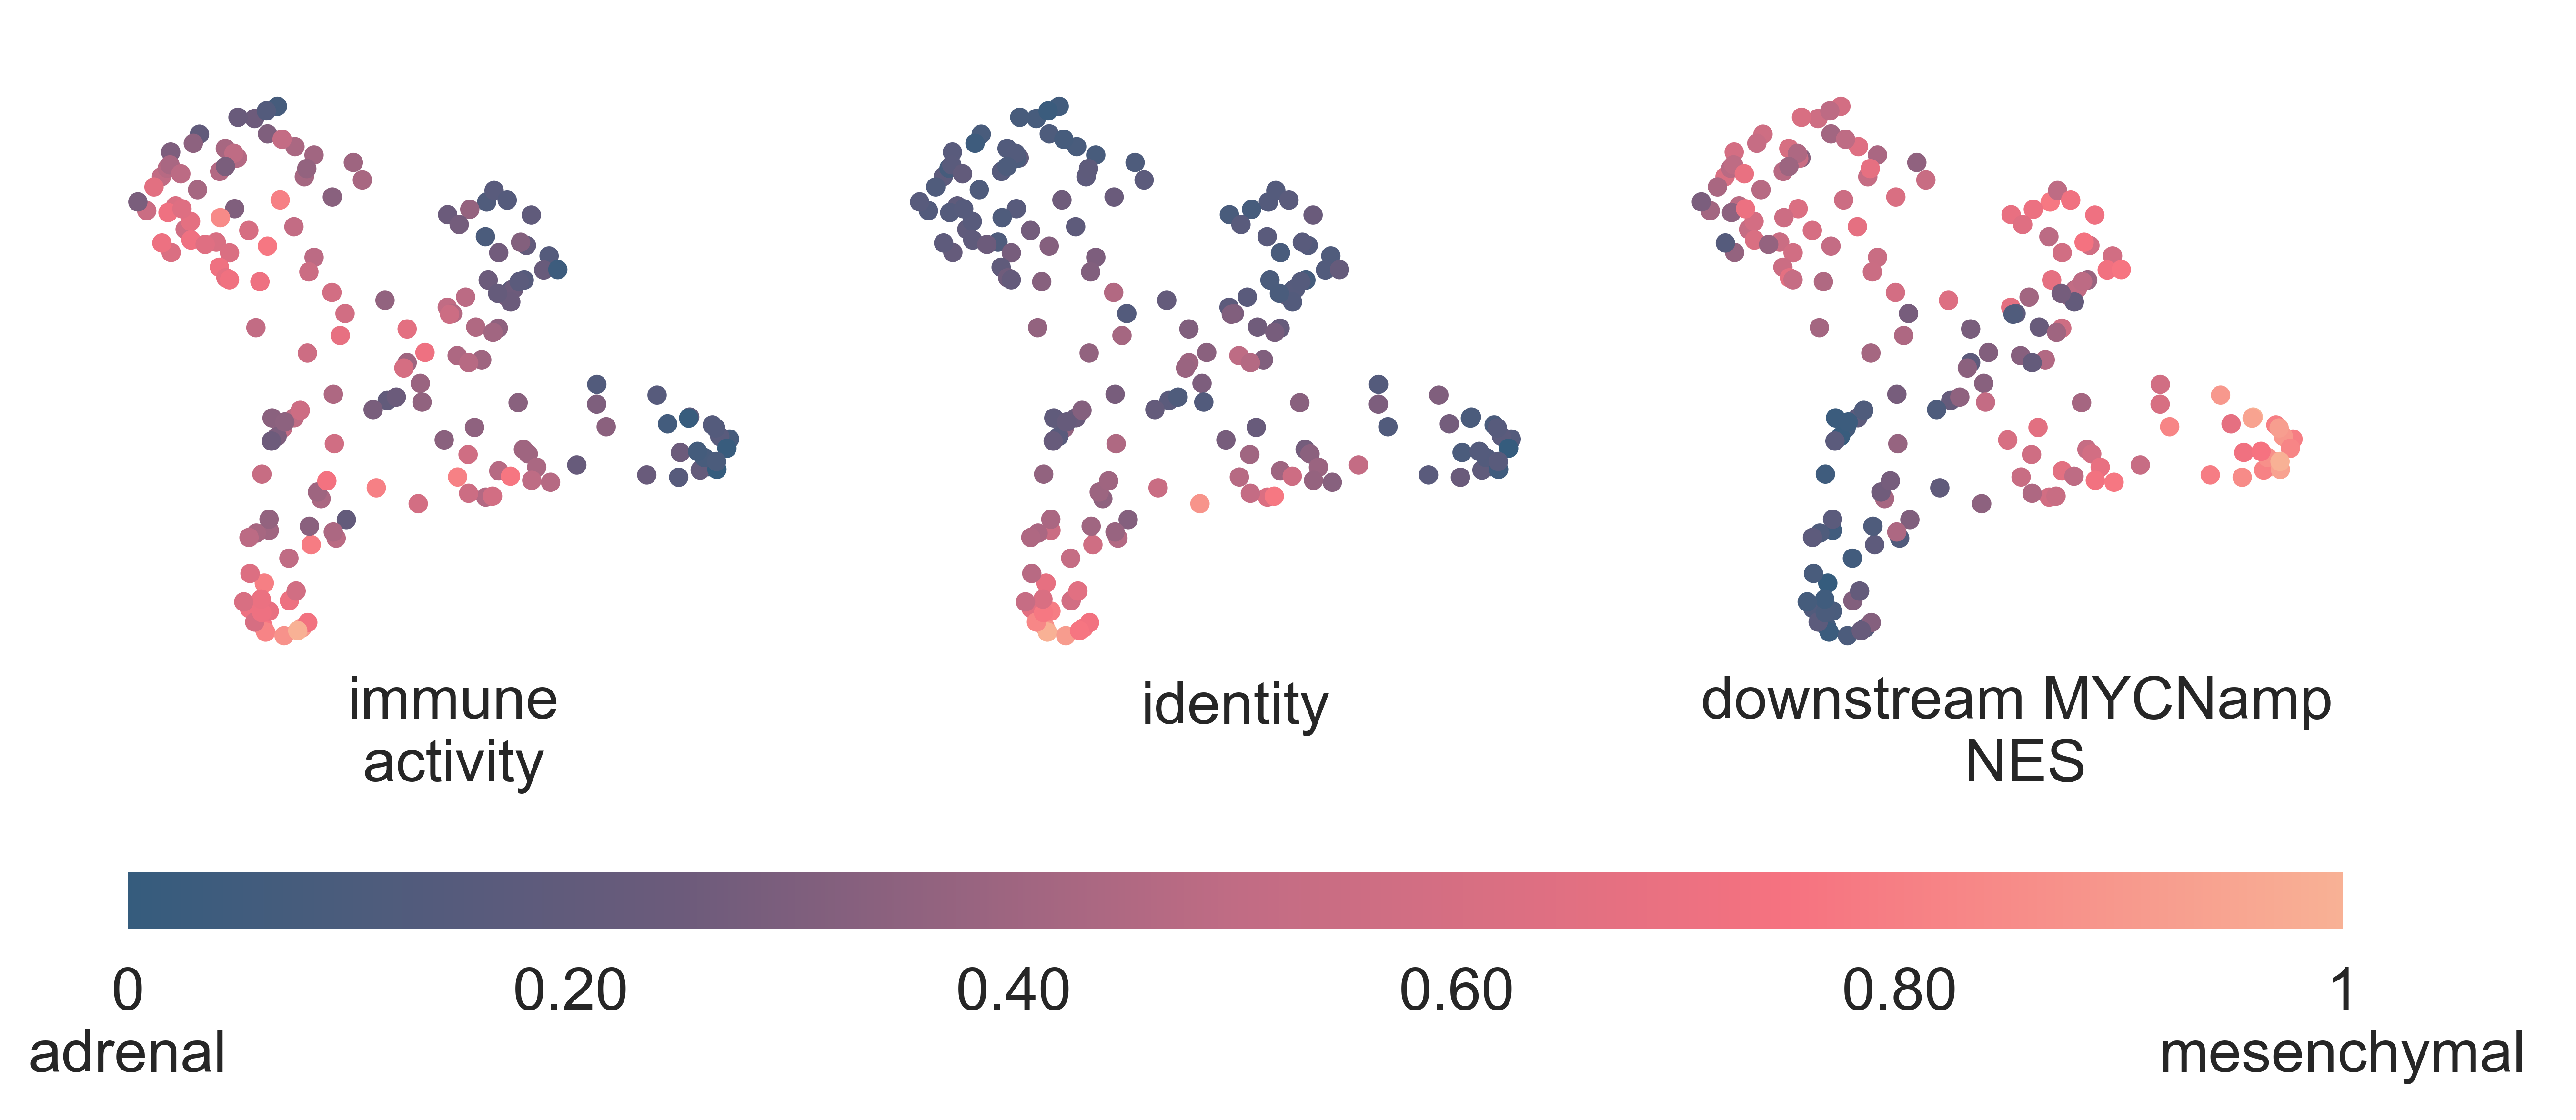
NEBLA3: 2-dimensional UMAP projection of the neuroblastoma samples coloured according to different scales. From left to right: immune activity score (from 0 to 1), identity (from adrenal to mesenchymal) and median Normalized Enrichment Score (from 0 to 1) of a set of genes downstream to MYCN amplification.
T063 NEBLA ADR NTRK1, the most populous subgroup, corresponds to microarray cluster p13, and is characterized by overexpression of NTRK1 with respect to its sibling clusters (medLogFC = 1.51, FDR < 5.78e-4). Patients with tumors within this class are significantly younger than ones in other NEBLA clusters (KW adj. p-val = 1.25e-05). It contains all samples classified as low and intermediate COG risk by TARGET (χ2 p-val = 1.04e-08), and contains all patients classified as stage 4s (χ2 p-val = 2.76e-07) and stage 3 (χ2 p-val = 3.58e-2) (Fig. S22b). It is significantly enriched in patients with tumors with favourable histology (χ2 p-val = 3.30e-08), and also contains the only intermixed ganglioneuroblastoma tumor referenced in the TARGET cohort (Fig. NEBLA2). T063 shows enrichment of gene sets related to sympathetic nervous system development (medNES = 1.08, KW adj. p-val = 1.97e-17, Dunn adj. p-val < 1.00e-02) and chromaffin cells (medNES = 1.11, adj. p-val = 4.49e-17, Dunn adj. p-val < 1.00e-04) [Ashburner2000], [TGOC2019], suggesting this cluster may be defined by sympathoadrenal differentiation. It carries low immune infiltration (median score 0.29) and high stemness (median score 0.77) Fig. NEBLA4.
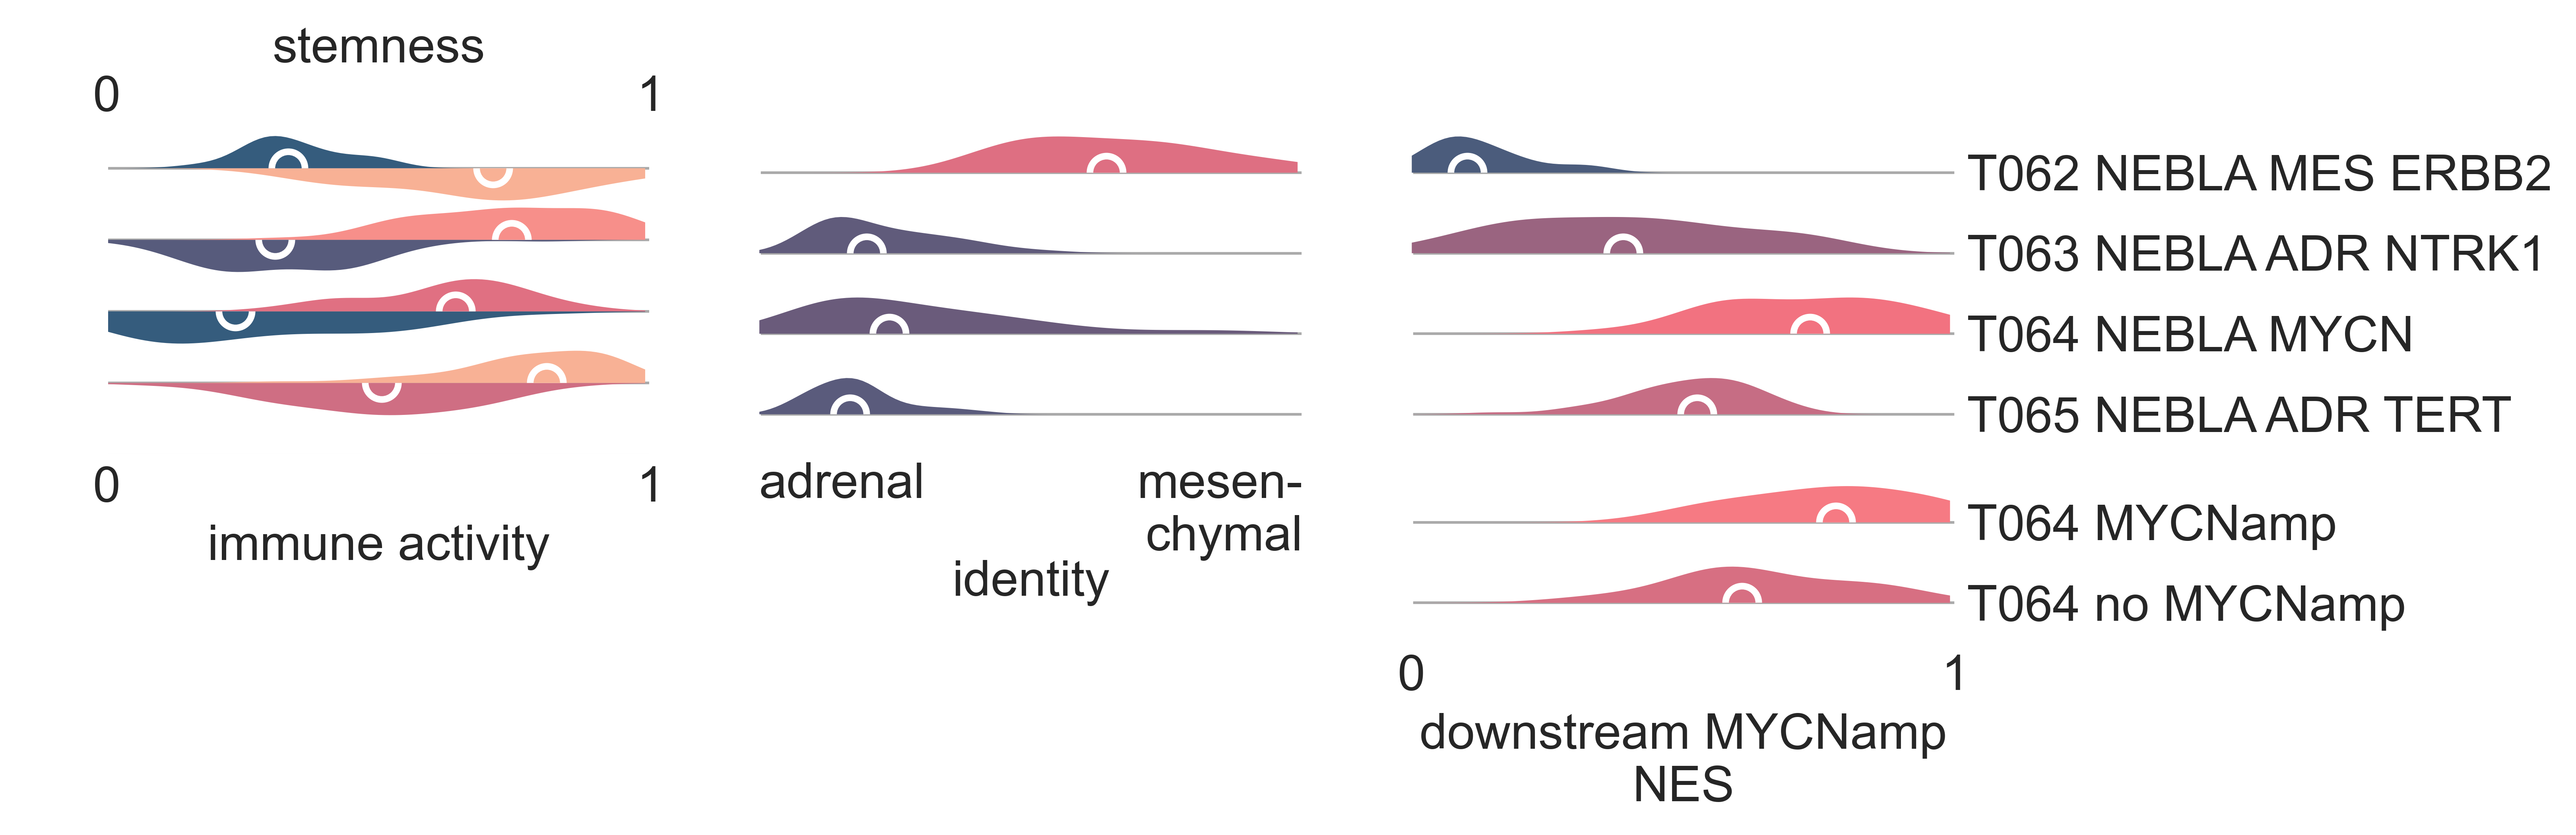
NEBLA4: Distribution plots of various scores across the four identified neuroblastoma subtypes. From left to right: stemness score (top half), immune activity score (bottom half), identity and median Normalized Enrichment Score of a set of genes downstream to MYCN amplification. The last panel also includes at the bottomsamples in T064 NEBLA MYCN while split in two groups, according to their MYCN amplification status by clinical tests as reported by the presenting institution.
The two remaining clusters, T064 NEBLA MYCN and T065 NEBLA ADR TERT, are exclusively comprised of samples marked as COG high-risk (Fig. NEBLA2), and overlap with microarray clusters p3 and p2 [Abel2011], respectively. Both clusters exhibit overexpression of BIRC5 compared to T062 NEBLA ERBB2 and T063 NEBLA ADR NTRK1 (T064 logFC (log-Fold Change)` = 1.74, FDR = 3.33e-05; T065 logFC = 2.05, FDR = 9.47e-07). T064 NEBLA MYCN is characterized by a statically significant overexpression of MYCN (medLogFC = 1.51, FDR ≤ 5.78e-04), and contains the majority of samples flagged as MYCN amplified by TARGET (χ2 p-val = 7.31e-15) (Fig. NEBLA1). It is also defined by the underexpression of NTRK1 (logFC = -3.25, FDR = 1.99e-09). Though the majority of T064 NEBLA MYCN samples are marked by TARGET as MYCN-amplified, 37.5% of samples (n = 9/34) are annotated as non-amplified. However, gene set analysis with downstream MYCN targets from literature [Valentijn2012] shows continued enrichment of MYCN targets in these samples despite the absence of MYCN amplification (with all samples, medNES = 1.22, KW adj. p-val = 8.64e-17, Dunn adj. p-val < 1.00e-04, with only MYCN-non amplified tumors in T064, medNES = 1.07, KW adj. p-val = 7.62e-11) (Fig. NEBLA3, NEBLA4). In line with previous studies, which identified a correlation between MYCN-amplified tumors and mitosis-karryohexis index (MKI) [Teshiba2014], we observe significantly more samples carrying high MKI (13/33, χ2 p-val = 1.03e-02) in T064 when compared to the other classes.
Both T064 NEBLA MYCN and T065 NEBLA ADR TERT are characterized by significant TERT overexpression compared to T062 NEBLA ERBB2 and T063 NEBLA ADR NTRK1. Previous studies have explored the associations between telomere maintenance and prognosis in neuroblastoma, identifying three mutually exclusive pathways which are enriched in high risk tumors: ATRX upregulation, MYCN amplification, and TERT rearrangements, each of which result in the overexpression of TERT [Valentijn2015], [Duan2018]. Indeed, both T064 and T065 have enrichment of alternative telomere lengthening pathways (KW adj. p-val < 2.06e-14) [Nabetani2011], [Jassal2020] (Fig. NEBLA5). TERT rearrangements are associated with the upregulation of SLC6A18 and SLC6A19, genes neighbouring TERT on the distal side of its breakpoint. Both these genes were significantly upregulated in T065 NEBLA ADR TERT (SLC6A18, medLogFC = 3.77, FDR ≤ 3.78e-06; SLC6A19, medLogFC = 3.88, FDR < 2.96e-03), but not in T064 NEBLA MYCN , suggesting T065 NEBLA ADR TERT may be comprised of TERT-rearranged neuroblastomas. CCND1 amplification has been observed concurrently with TERT rearrangements in neuroblastomas [Fransson2020] and is highly upregulated in T065 (medLogFC = 1.09, FDR ≤ 5.67e-06). We find no significant differences in expression of ATRX between clusters. T065 exhibits the lowest expression of gene sets related to adrenal development (medNES = 0.39, KW adj. p-val = 2.14e-12, Dunn adj. p-val < 1.00e-04) [TGOC2019], [Ashburner2000], as well as low expression of mature chromaffin markers such as EPAS1 (medLogFC = -1.09, FDR ≤ 4.412e-02) [Westerlund2019], suggesting this cluster is formed of poorly differentiated neuroblastomas. To further support this hypothesis, we observe here the highest median stemness score (0.81) among all classes, while a non-negligible immune infiltration score is also observed (.45) (Fig. NEBLA3, NEBLA4). Hypermethylation of the TERT locus in high-risk neuroblastomas has been reported in literature [Olsson2016]. In line with this observation, T065 NEBLA ADR TERT shows enrichment for DNA methylation pathways (medNES ≥ 1.04, KW adj. p-val = 2.79e-14), and numerous histone modification gene sets: notably methylation of H3K4, a transcriptional inducer (medNES ≥ 1.02, KW p-val = 2.97e-13), and methylation of H3K9, a known silencer of tumor suppressors (medNES ≥ 1.15, KW p-val = 1.78e-12) [Ashburner2000], [TGOC2019], [Ke2014], [Durinck2018]. Furthermore, T065 is highly enriched for PRC2 complex activity (medNES ≥ 1.06, KW adj. p-val = 1.15e-14, Dunn adj. p-val < 1.00e-03) [Nishimura2001]. Though PRC2 activity is usually examined in the context of MYCN amplification [Corvetta2013], [Tsubota2017], [Chen2018], this data supports recent evidence of a PRC2 signature independent of MYCN amplification in high-risk neuroblastoma [Yang2017].
Both T064 NEBLA MYCN and T065 NEBLA ADR TERT show a characteristic enrichment of COSMIC signature 18 gene set (KW adj. p-val ≤ 4.87e-12) [Brady2020], associated with reactive oxygen species, when compared to T061 and T062 (Fig. NEBLA5). This signature has been suggested to be causative of point mutations in neuroblastoma and has been associated with MYCN amplification, and increased expression of electron-transport, ribosomal, and mitochondrial genes. The latter, in particular, follows from a 17q gain, a prognostic marker for poor outcome [Brady2020], [Kucab2019]. We observe significant enrichment of chromosome 17q gene sets in T065 NEBLA ADR TERT (medNES ≥ 1.20, KW adj. p-val ≤ 5.86e-04) [Yates2020]. Partial loss of 11q (q21-25), associated with TERT rearrangements in literature [Roderwieser2019], is also present in T065 (medNES ≤ 6.56e-01, KW p-val ≤ 1.03e-05). Our data support the existence of two major phenotypes with very poor outcome in canonically high-risk neuroblastoma, one driven by MYCN activation, the other by TERT activation independent of MYCN. While genomic rearrangements for samples in T065 were not reported, neuroblastomas lacking genomic rearrangements at the TERT locus, but expressing a high TERT phenotype, have been reported in literature [Roderwieser2019], [Ackermann2018]. We speculate T065 may also include samples with non-lesional TERT activation, potentially involving gain of 17q and loss of 11q.
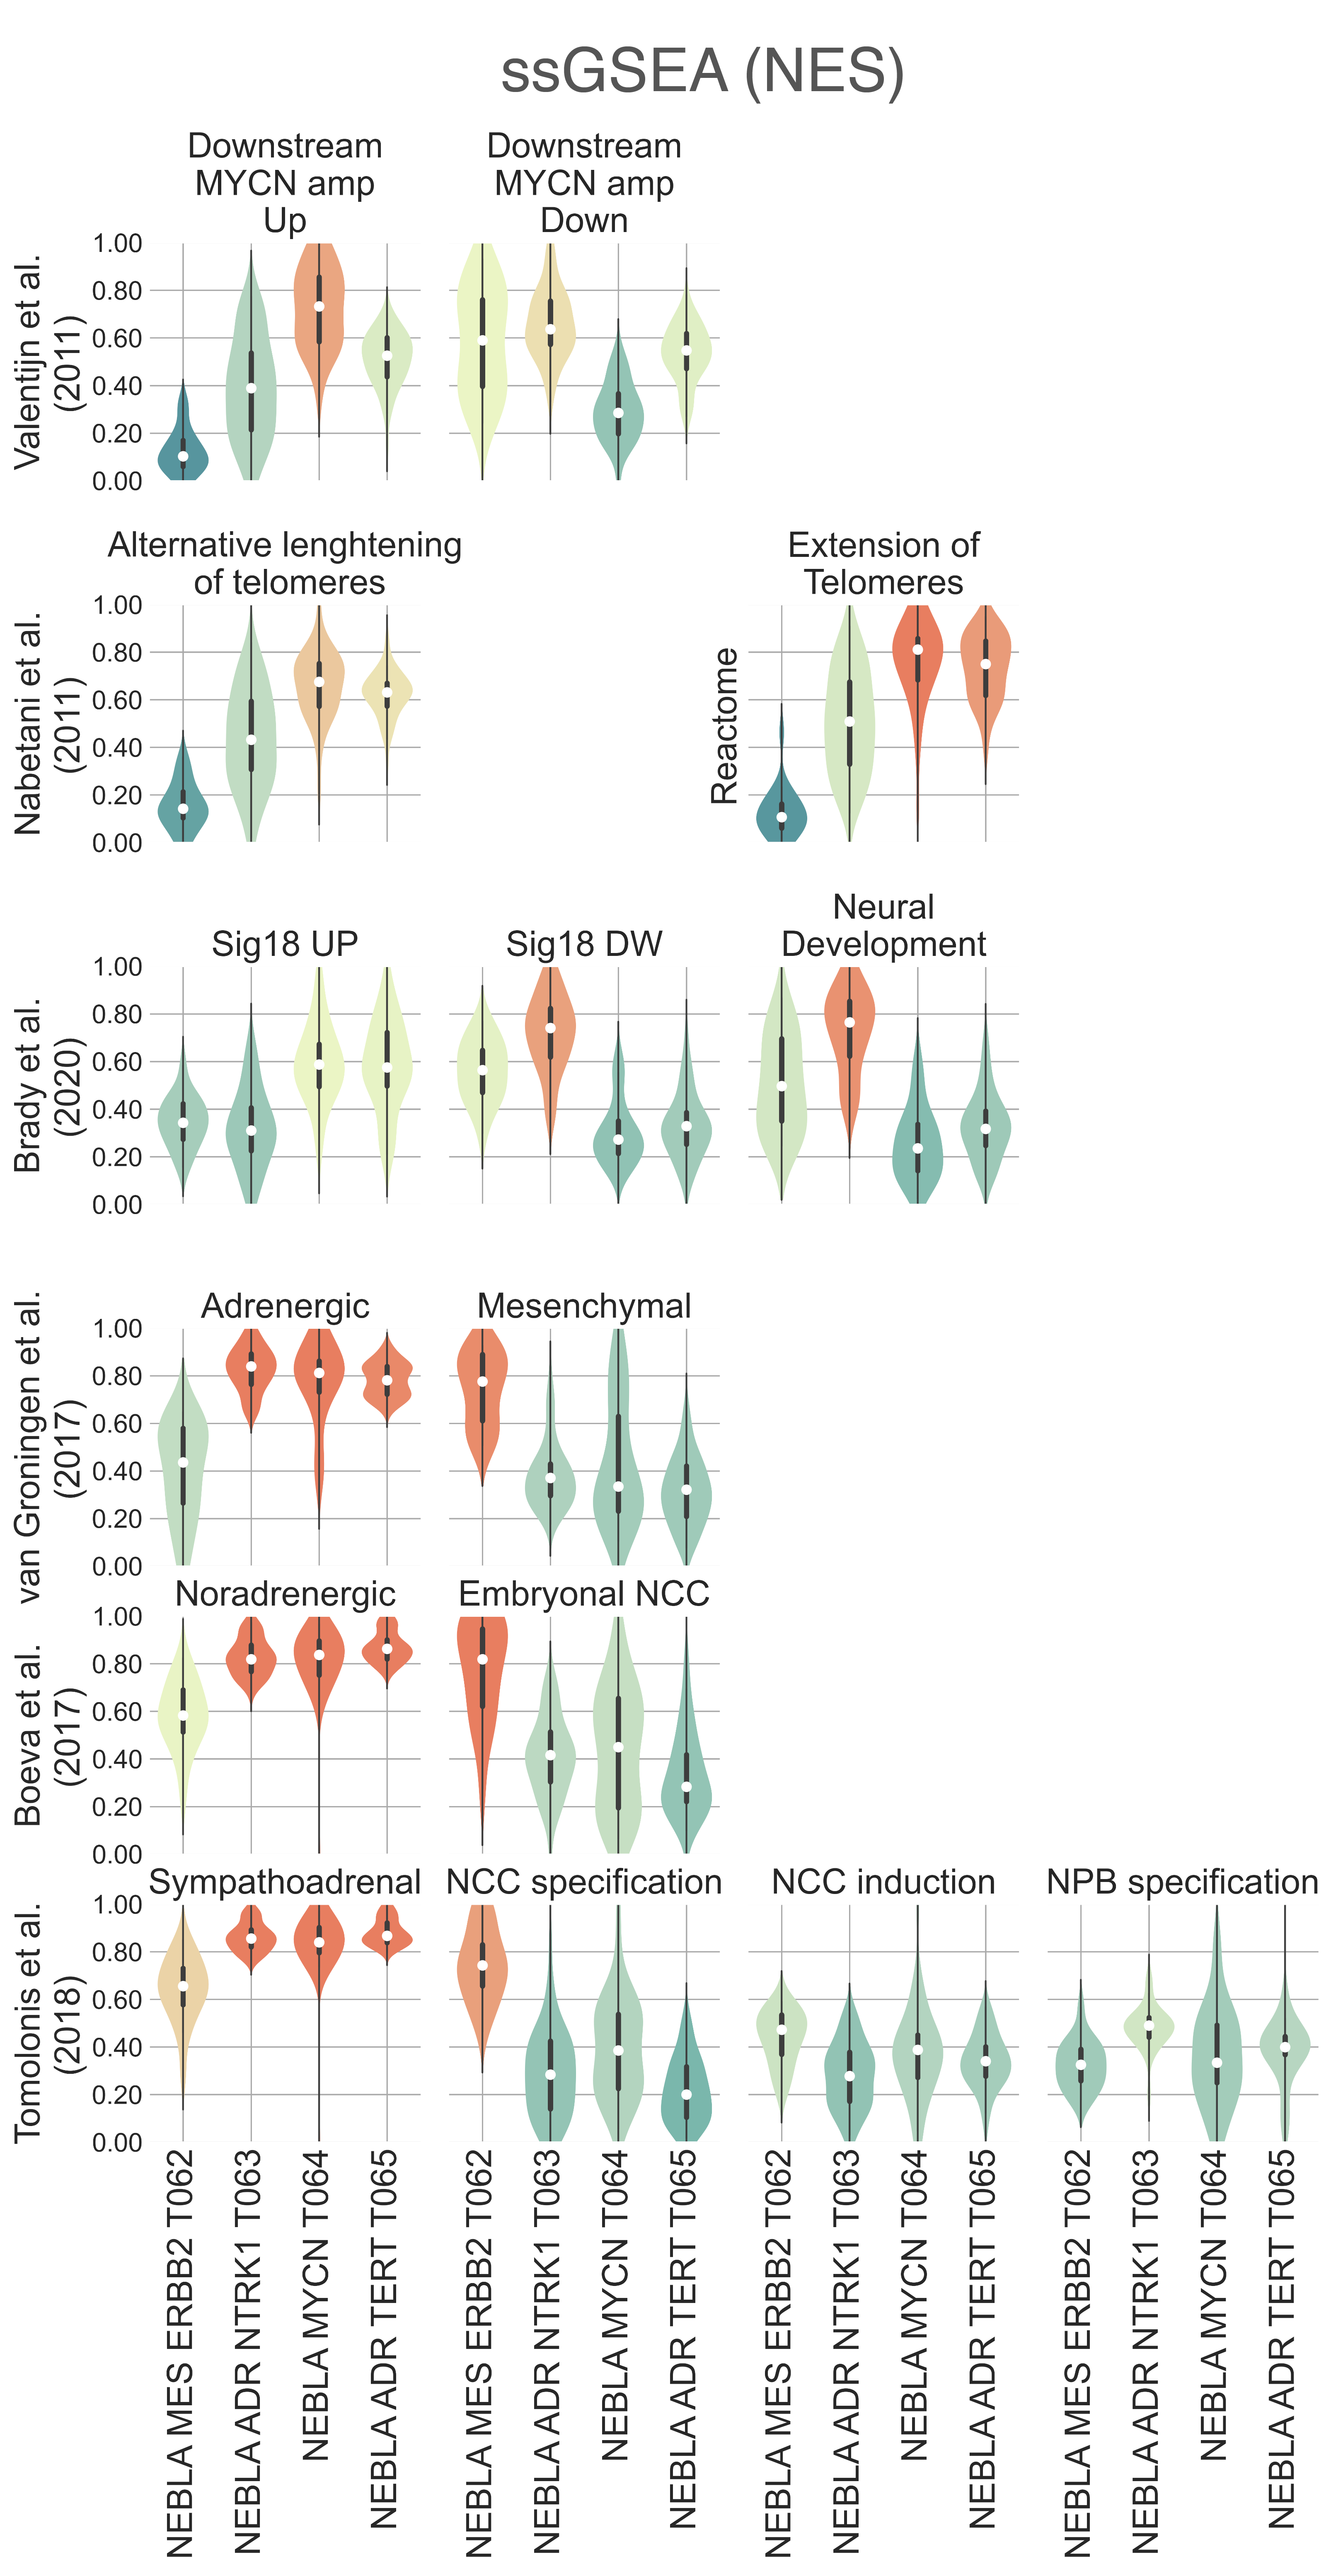
NEBLA5: Distribution plots of various gene sets enrichment scores relevant to the lineage definition across the four identified neuroblastoma subtypes.
The four neuroblastoma classes also show a significant segregation of samples by ploidy level. T063 contains most hyperdiploid tumors (34/46, χ2 p-val = 4.01e-03) and consequently has the highest median ploidy value (1.285, KW adj. p-val = 6.56e-03) (Fig. NEBLA2). T062 NEBLA ERBB2 and T064 NEBLA MYCN have the lowest median value (1.00 both), with the former having a majority of diploid members (9/12, χ2 p-val = 4.01e-03) (Fig. NEBLA2).
Furthermore, we observe a significant separation between the Kaplan-Meier fitted curves of overall survival rates (OS, available only for TARGET data, lrt p-val = 1.36e-02 at 4948 days) (Fig. NEBLA6). As expected, patients with tumors in T064 NEBLA MYCN have the poorest outcome, followed by T065 NEBLA ADR TERT, T062 NEBLA ERBB2 and finally T062 NEBLA ADR NTRK1. This is consistent with literature: improved survival was documented for ERBB2-overexpressing neuroblastomas [Izycka-Swieszewska2010], although here observed only against other COG high-risk samples.
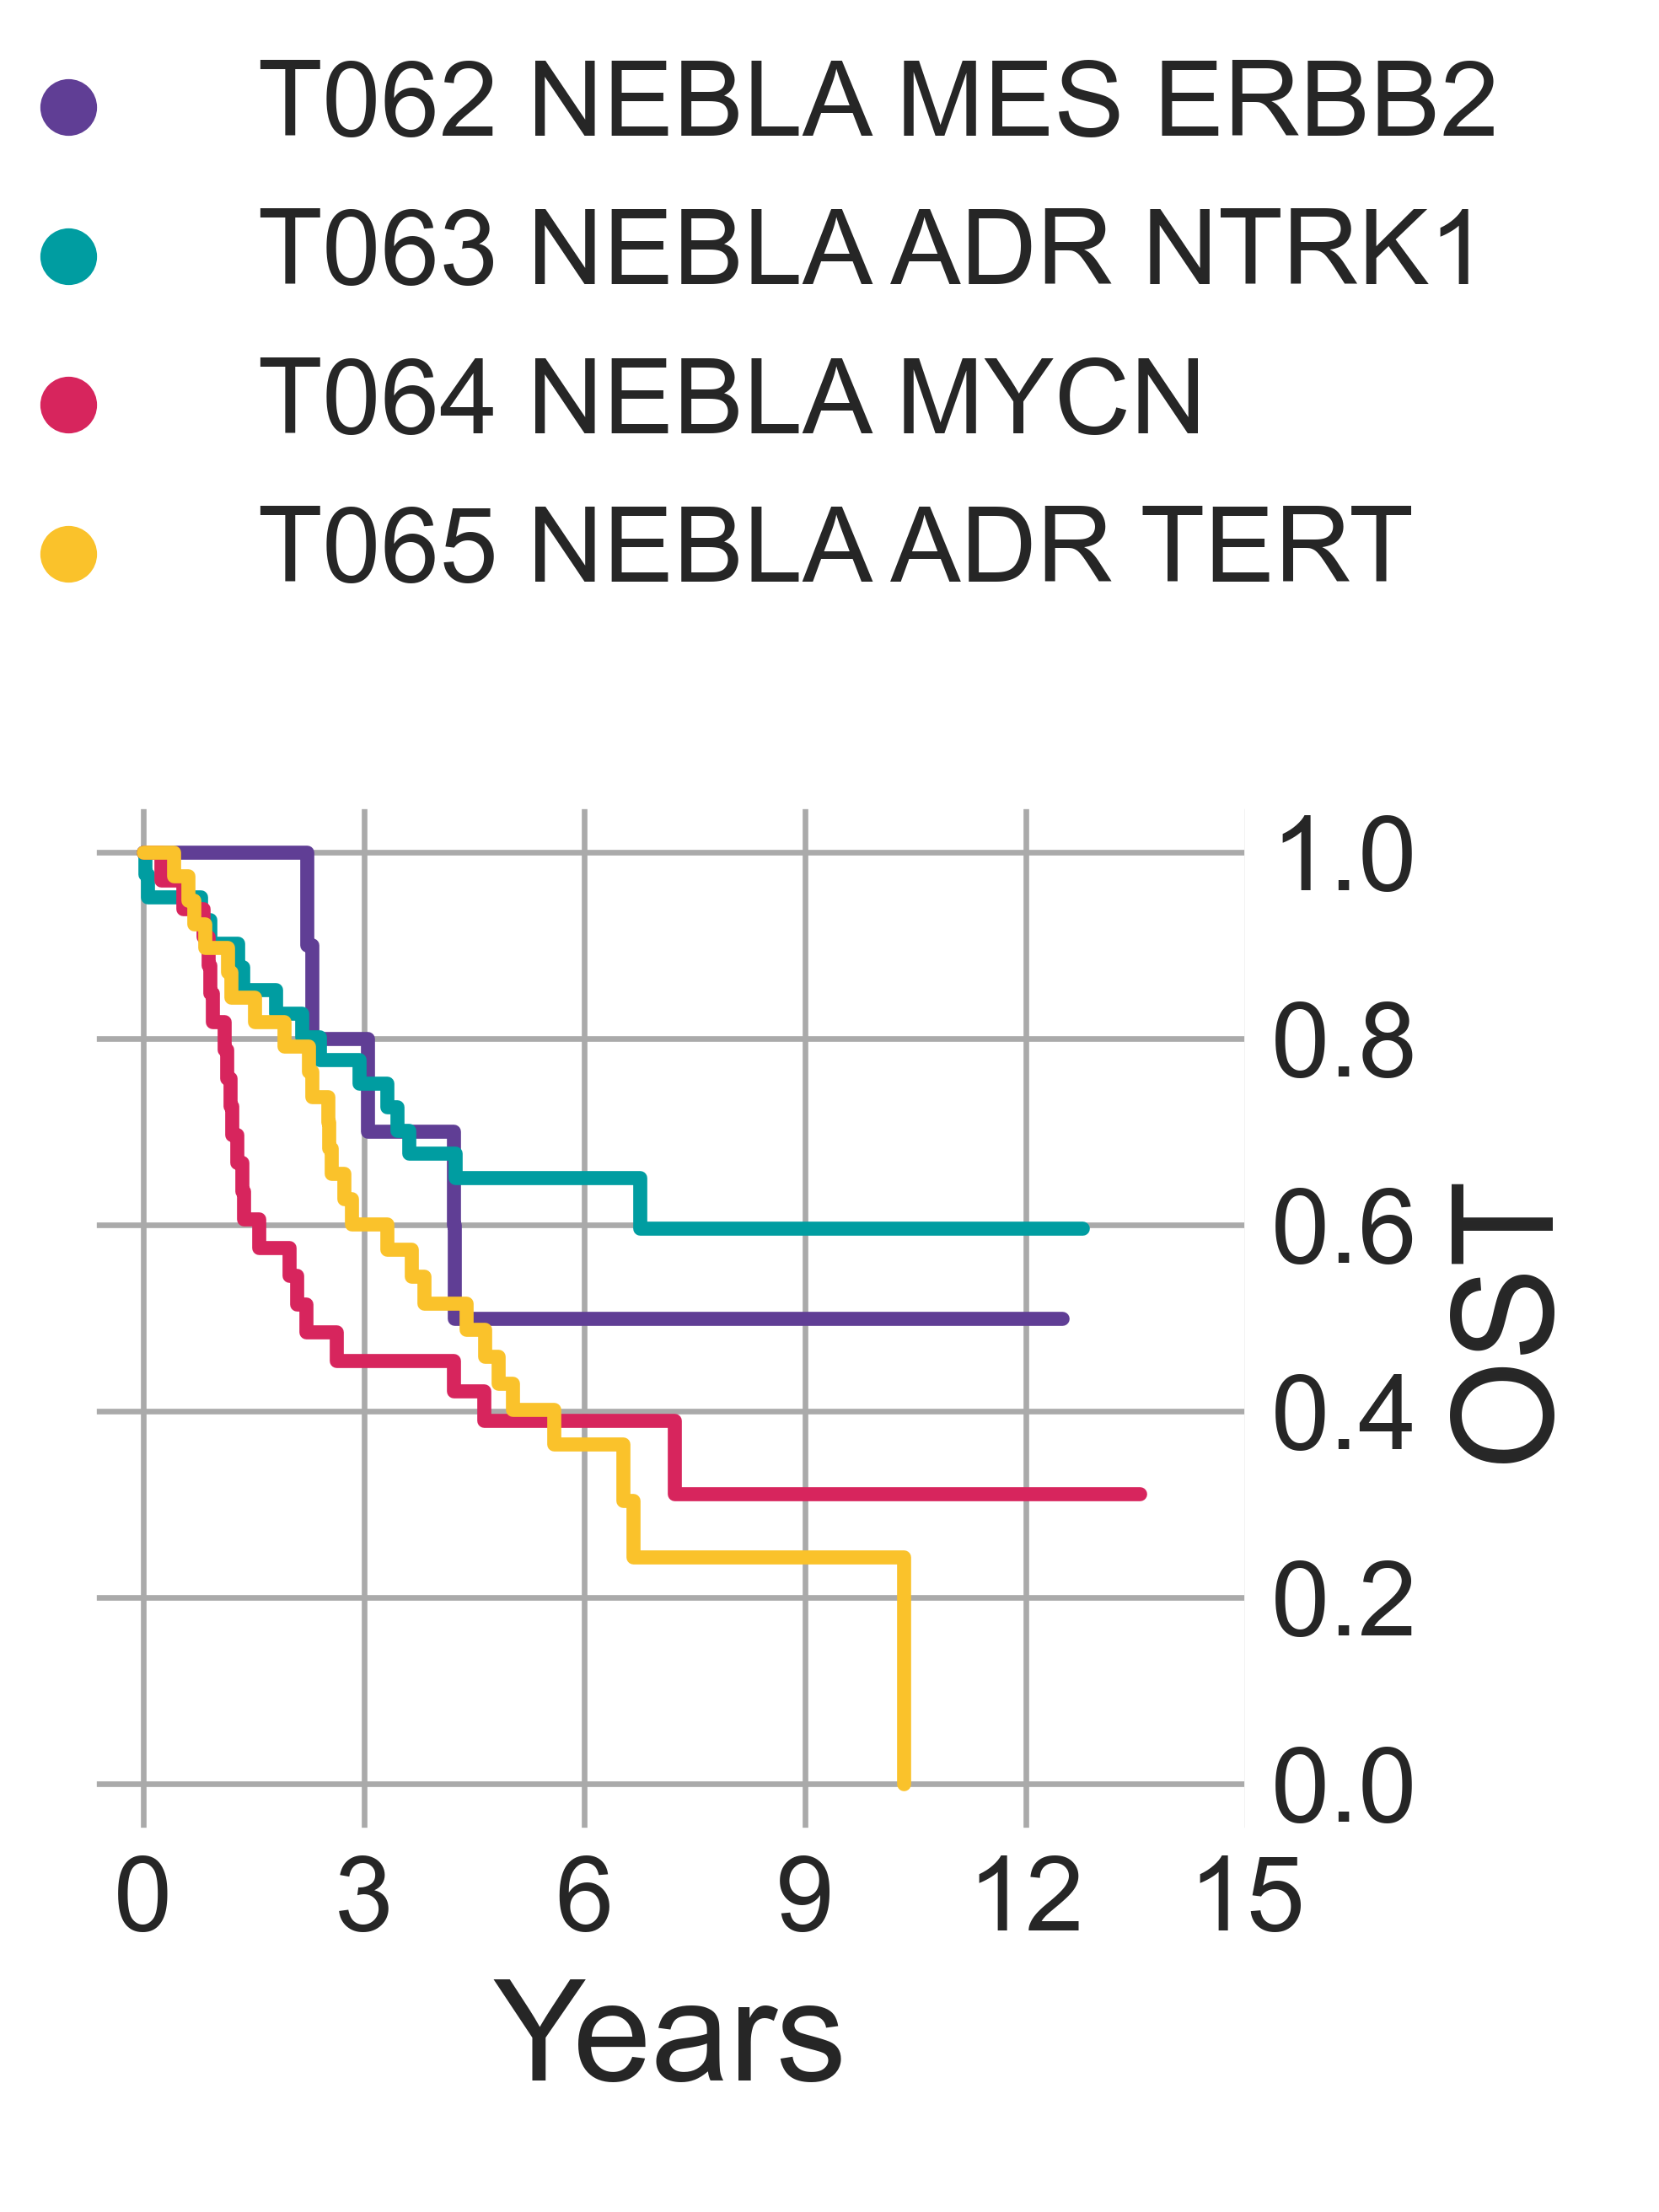
NEBLA5: Overall survival time curves of the four identified neuroblastoma subtypes.
Recent work investigated linage and developmental differences across neuroblastomas and identified two major groups defined by distinct expression modules driven: a sympathoadrenal identity and neural-crest cell-like (NCC-like)/mesenchymal identity. These developmental states are mediated epigenetically through the action of of super-enhancer and super-enhancer related transcriptional factor networks. Neuroblastomas can move from one to the other identity under selective pressure, induced by therapy or epigenetic alterations and often contain intermixed populations [Boeva2017], [vanGroningen2017]. We thus decided to search for overlaps between these developmental identities and our clusters. Interestingly, we observe the characteristic signature of both lineages in all clusters although expressed to different degrees. T062 NEBLA ERBB2 in particular is committed to an NCC-like linage as shown by high expression of NCC-like and mesenchymal markers (medNES = 1.57, KW adj. p-val = 3.69e-07, Dunn adj. p-val < 1.00e-03) against all other classes (Fig. NEBLA3, NEBLA4). These in turn show enrichment noradrenergic and sympathoadrenal gene sets (KW adj. p-val ≤ 1.19e-09) [Boeva2017], [vanGroningen2017], [Tomolonis2018] (Fig. NEBLA5). Samples belonging to T065 NEBLA ADR TERT seem to be the most committed to the sympathoadrenal specification (Dunn adj. p-val < 0.05 against T062 and T064) (Fig. NEBLA4). T064 NEBLA MYCN shows high variation in the values of its enrichment scores for both linages (Fig. NEBLA4). The expression profile downstream of MYCN amplification may have overridden the original identity signal, or alternatively mixed-lineage populations are common in MYCN-amplified samples.
Bibliography
- Abel2011(1,2)
Abel, F., Dalevi, D., Nethander, M.,2011. A 6-gene signature identifies four molecular subgroups of neuroblastoma. Cancer cell international 11, p. 9.
- Ackermann2018
Ackermann, S., Cartolano, M., Hero, B.,2018. A mechanistic classification of clinical phenotypes in neuroblastoma. Science 362(6419), pp. 1165–1170.
- Ashburner2000(1,2,3,4,5)
Ashburner, M., Ball, C.A., Blake, J.A.,2000. Gene Ontology: tool for the unification of biology. Nature Genetics 25(1), pp. 25–29.
- Boeva2017(1,2)
Boeva, V., Louis-Brennetot, C., Peltier, A.,2017. Heterogeneity of neuroblastoma cell identity defined by transcriptional circuitries. Nature Genetics 49(9), pp. 1408–1413.
- Brady2020(1,2)
Brady, S.W., Liu, Y., Ma, X.,2020. Pan-neuroblastoma analysis reveals age- and signature-associated driver alterations. Nature Communications 11(1), p. 5183.
- Chen2018
Chen, L., Alexe, G., Dharia, N.V.,2018. CRISPR-Cas9 screen reveals a MYCN-amplified neuroblastoma dependency on EZH2. The Journal of Clinical Investigation.
- Corvetta2013
Corvetta, D., Chayka, O., Gherardi, S.,2013. Physical interaction between MYCN oncogene and polycomb repressive complex 2 (PRC2) in neuroblastoma: functional and therapeutic implications. The Journal of Biological Chemistry 288(12), pp. 8332–8341.
- Duan2018
Duan, X.-F. and Zhao, Q. 2018. TERT-mediated and ATRX-mediated Telomere Maintenance and Neuroblastoma. Journal of Pediatric Hematology/Oncology 40(1), pp. 1–6.
- Durinck2018
Durinck, K. and Speleman, F. 2018. Epigenetic regulation of neuroblastoma development. Cell and Tissue Research 372(2), pp. 309–324.
- Fransson2020
Fransson, S., Martinez-Monleon, A., Johansson, M.,2020. Whole-genome sequencing of recurrent neuroblastoma reveals somatic mutations that affect key players in cancer progression and telomere maintenance. Scientific Reports 10(1), p. 22432.
- vanGroningen2017(1,2)
van Groningen, T., Koster, J., Valentijn, L.J.,2017. Neuroblastoma is composed of two super-enhancer-associated differentiation states. Nature Genetics 49(8), pp. 1261–1266.
- Izycka-Swieszewska2010(1,2,3)
Izycka-Swieszewska, E., Wozniak, A., Kot, J.,2010. Prognostic significance of HER2 expression in neuroblastic tumors. Modern Pathology 23(9), pp. 1261–1268.
- Jassal2020
Jassal, B., Matthews, L., Viteri, G.,2020. The Reactome Pathway Knowledgebase. Nucleic Acids Research 48(D1), pp. D498–D503.
- Ke2014
Ke, X.-X., Zhang, D., Zhu, S., Xia, Q., Xiang, Z. and Cui, H. 2014. Inhibition of H3K9 methyltransferase G9a repressed cell proliferation and induced autophagy in neuroblastoma cells. Plos One 9(9), p. e106962.
- Kucab2019
Kucab, J.E., Zou, X., Morganella, S.,2019. A compendium of mutational signatures of environmental agents. Cell 177(4), p. 821–836.e16.
- Nabetani2011
Nabetani, A. and Ishikawa, F. 2011. Alternative lengthening of telomeres pathway: recombination-mediated telomere maintenance mechanism in human cells. Journal of Biochemistry 149(1), pp. 5–14.
- Nishimura2001
Nishimura, D. 2001. BioCarta. Biotech Software & Internet Report 2(3), pp. 117–120.
- Olsson2016
Olsson, M., Beck, S., Kogner, P., Martinsson, T. and Carén, H. 2016. Genome-wide methylation profiling identifies novel methylated genes in neuroblastoma tumors. Epigenetics 11(1), pp. 74–84.
- Roderwieser2019(1,2)
Roderwieser, A., Sand, F., Walter, E.,2019. Telomerase is a prognostic marker of poor outcome and a therapeutic target in neuroblastoma. JCO precision oncology (3), pp. 1–20.
- Schaefer2009
Schaefer, C.F., Anthony, K., Krupa, S.,2009. PID: the pathway interaction database. Nucleic Acids Research 37(Database issue), pp. D674-9.
- Teshiba2014
Teshiba, R., Kawano, S., Wang, L.L.,2014. Age-dependent prognostic effect by Mitosis-Karyorrhexis Index in neuroblastoma: a report from the Children’s Oncology Group. Pediatric and developmental pathology : the official journal of the Society for Pediatric Pathology and the Paediatric Pathology Society 17(6), pp. 441–449.
- TGOC2019(1,2,3,4,5)
The Gene Ontology Consortium 2019. The Gene Ontology Resource: 20 years and still GOing strong. Nucleic Acids Research 47(D1), pp. D330–D338.
- Tomolonis2018
Tomolonis, J.A., Agarwal, S. and Shohet, J.M. 2018. Neuroblastoma pathogenesis: deregulation of embryonic neural crest development. Cell and Tissue Research 372(2), pp. 245–262.
- Tsubota2017
Tsubota, S., Kishida, S., Shimamura, T.,2017. PRC2-Mediated Transcriptomic Alterations at the Embryonic Stage Govern Tumorigenesis and Clinical Outcome in MYCN-Driven Neuroblastoma. Cancer Research 77(19), pp. 5259–5271.
- Valentijn2012
Valentijn, L.J., Koster, J., Haneveld, F.,2012. Functional MYCN signature predicts outcome of neuroblastoma irrespective of MYCN amplification. Proceedings of the National Academy of Sciences of the United States of America 109(47), pp. 19190–19195.
- Valentijn2015
Valentijn, L.J., Koster, J., Zwijnenburg, D.A.,2015. TERT rearrangements are frequent in neuroblastoma and identify aggressive tumors. Nature Genetics 47(12), pp. 1411–1414.
- Westerlund2019
Westerlund, I., Shi, Y. and Holmberg, J. 2019. EPAS1/HIF2α correlates with features of low-risk neuroblastoma and with adrenal chromaffin cell differentiation during sympathoadrenal development. Biochemical and Biophysical Research Communications 508(4), pp. 1233–1239.
- Yang2017
Yang, X.H., Tang, F., Shin, J. and Cunningham, J.M. 2017. Incorporating genomic, transcriptomic and clinical data: a prognostic and stem cell-like MYC and PRC imbalance in high-risk neuroblastoma. BMC Systems Biology 11(Suppl 5), p. 92.
- Yates2020
Yates, A.D., Achuthan, P., Akanni, W.,2020. Ensembl 2020. Nucleic Acids Research 48(D1), pp. D682–D688.